
Top 10 REST Monitoring Tools for API Performance & Uptime
REST APIs are the communication highways of today's digital world, linking disparate systems, microservices, and client applications.


TL;DR
1. Consistent API performance and uptime are critical for modern applications and user experience.
2. REST API monitoring tools offer crucial insights into availability, latency, and error rates.
3. Synthetic monitoring simulates user interactions, while real user monitoring (RUM) captures actual API usage.
4. Key features to look for include multi-location checks, alerts, detailed analytics, and integration capabilities.
5. Top tools like Postman, New Relic, Datadog, and Dynatrace provide comprehensive solutions for diverse needs.
Ensure your REST APIs are always performing optimally with DigitalAPI. Book a Demo!
In a landscape increasingly powered by interconnected services, the reliability of REST APIs forms the backbone of digital experiences. From mobile apps fetching real-time data to backend systems communicating seamlessly, any API hiccup can cascade into significant business disruption and user dissatisfaction. Proactive monitoring isn't just a best practice; it's a fundamental requirement for maintaining operational excellence and ensuring your services remain robust and responsive around the clock.
Effective REST API monitoring provides deep visibility into performance metrics, potential bottlenecks, and critical failures before they impact end-users. It empowers development and operations teams to quickly identify, diagnose, and resolve issues, safeguarding service quality and protecting revenue streams. Choosing the right tools can make all the difference in building a resilient and high-performing API ecosystem.
Why REST API Monitoring is Crucial for Modern Applications
REST APIs are the communication highways of today's digital world, linking disparate systems, microservices, and client applications. Their consistent performance and availability are non-negotiable for delivering seamless user experiences and enabling critical business operations. When an API falters, it can lead to cascading failures, impacting everything from customer-facing applications to internal data processing workflows.
Robust API monitoring is essential for several reasons. Firstly, it ensures uptime, guaranteeing that services are always accessible. Secondly, it helps maintain optimal performance, preventing slow response times that frustrate users and degrade application functionality. Lastly, effective monitoring quickly identifies errors and anomalies, allowing teams to proactively address issues, reduce mean time to resolution (MTTR), and prevent minor glitches from escalating into major outages. Without it, organizations operate in the dark, risking reputation, revenue, and customer trust.
Key Aspects of Effective REST API Monitoring
When evaluating REST API monitoring tools, several core capabilities stand out as essential for comprehensive oversight. These features collectively ensure that teams have the visibility and control needed to maintain high-performing and reliable APIs.
Synthetic monitoring, for instance, simulates user requests from various global locations, providing a baseline for performance and uptime. Real User Monitoring (RUM), while less common for direct API monitoring, can offer insights into how actual users experience API interactions within an application. Alerting mechanisms are paramount, providing instant notifications via multiple channels when predefined thresholds are breached. Detailed analytics and reporting offer historical context, trend analysis, and performance comparisons, crucial for long-term optimization and capacity planning. Furthermore, the ability to integrate with existing CI/CD pipelines, incident management systems, and other observability platforms ensures a cohesive monitoring strategy.
Top 10 REST Monitoring Tools for API Performance & Uptime
1. DigitalAPI (DigitalAPI.ai)
DigitalAPI is a modern API intelligence and observability platform designed for organizations managing large, distributed REST API estates across multiple gateways. Instead of monitoring APIs in isolation, it provides a unified view across internal, partner, and external APIs, regardless of where they are deployed.
For REST API monitoring, DigitalAPI goes beyond basic uptime and latency checks by adding context. It correlates performance, usage, access, and ownership data, helping teams understand not just whether an API is healthy, but who is using it, how it’s being used, and whether that usage aligns with governance and business intent, a critical capability as APIs are increasingly consumed by automation and AI agents.
Key Features
- Unified API Monitoring Across Gateways: Monitor REST APIs spanning Apigee, AWS API Gateway, Kong, MuleSoft, and more from one platform
- Performance & Usage Analytics: Track latency, errors, traffic trends, and consumer-level usage patterns
- Context-Aware Alerts: Alert on performance issues combined with access, quota, or behavioral anomalies
- API Catalog + Monitoring: Link live monitoring data directly to API documentation, ownership, and lifecycle state
- AI- & Agent-Ready Visibility: Designed to support APIs consumed by automation and AI agents, not just human developers
Pros
- Built for Multi-Gateway Reality: Ideal for enterprises with fragmented API landscapes
- Operational + Governance Context: Monitoring tied to ownership, access control, and policy, not just metrics
- Single Source of Truth: Combines discovery, monitoring, and analytics in one platform
- Future-Ready: Strong fit for organizations preparing APIs for AI agents and automated consumption
Cons
- Not a Lightweight Tool: Overkill if you only need simple ping or uptime checks
- Enterprise-Focused: Best suited for mid-to-large teams managing API sprawl
- Requires Gateway Integration: Value increases as more gateways are connected

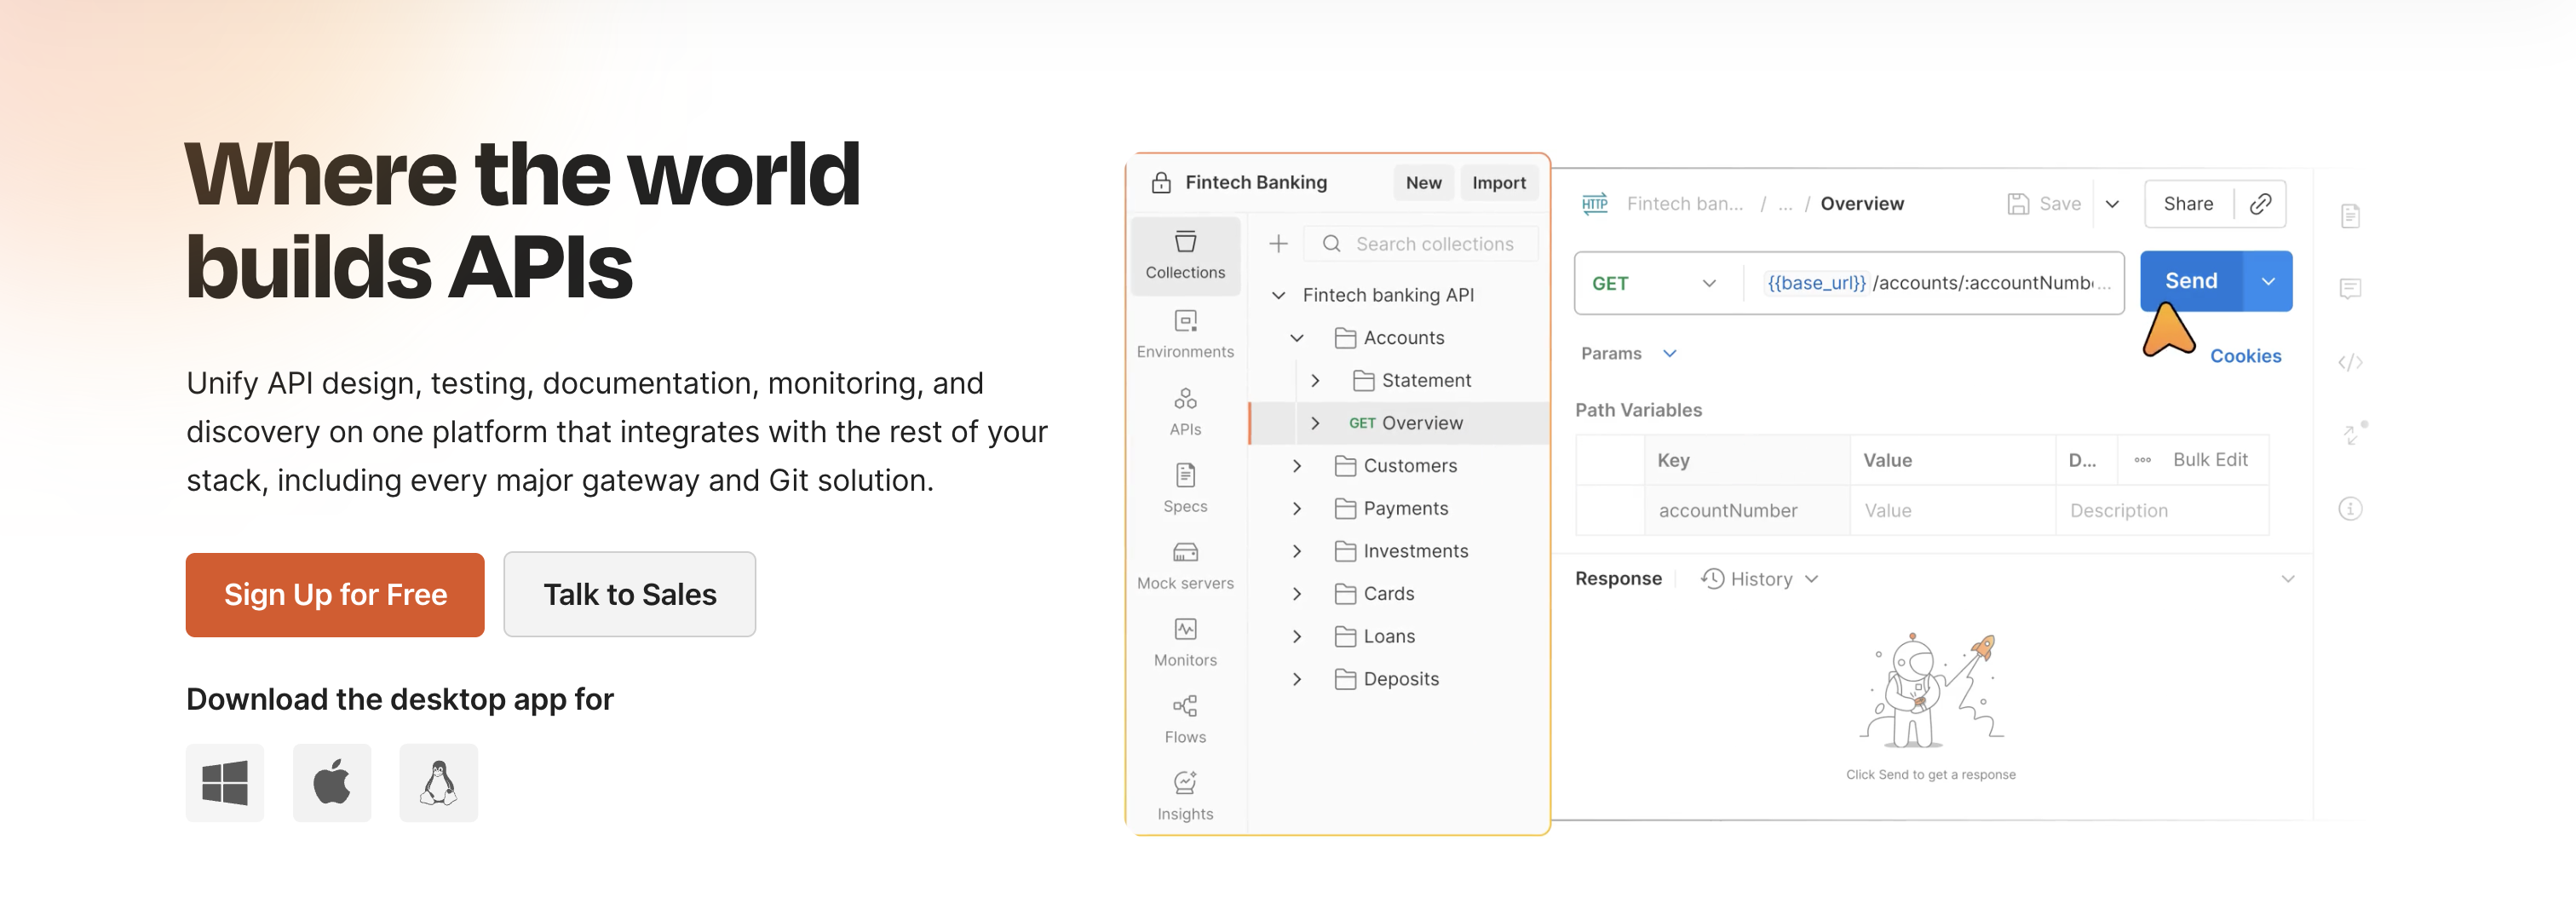
2. Postman
Postman is widely recognized as an indispensable tool for API development, testing, and collaboration. Its robust set of features extends seamlessly into monitoring, allowing teams to keep a close eye on their APIs directly within their familiar development environment.
With Postman Monitoring, users can schedule collections to run at regular intervals from various geographic regions. This capability helps ensure that APIs are consistently available and performing as expected across different user bases, integrating monitoring directly into the API lifecycle from design to deployment.
Key Features
- Collection-based Monitoring: Schedule Postman collections to run automatically.
- Multi-Location Checks: Monitor APIs from global regions to identify regional issues.
- Alerts & Notifications: Receive alerts via email, Slack, or webhooks on failures or performance degradation.
Pros
- Integrated Workflow: Seamlessly extends from API development and testing to monitoring.
- Ease of Use: Intuitive interface for setting up and managing monitors.
- Cost-Effective: Often included in existing Postman plans, making it accessible.
Cons
- Limited Advanced Analytics: May not offer the deep APM insights of dedicated monitoring solutions.
- Basic Alerting: Alerting rules can be less granular compared to specialized tools.
- Scripting Dependency: Relies heavily on Postman scripts for complex monitoring scenarios.
3. New Relic
New Relic stands as a prominent full-stack observability platform, offering comprehensive solutions for monitoring applications, infrastructure, and user experiences. Its API monitoring capabilities are a crucial component, providing deep insights into the performance and availability of RESTful services within complex distributed systems.
Through synthetic monitoring, New Relic allows users to simulate API calls from various global locations, proactively identifying issues before they affect end-users. Coupled with its robust APM features, New Relic offers a holistic view, enabling teams to trace transactions across services and pinpoint the root cause of API performance problems swiftly.
Key Features
- Synthetic Monitoring: Execute API endpoints from diverse locations to check availability and response times.
- Distributed Tracing: Track API requests across microservices to identify bottlenecks.
- Alerts & Dashboards: Customizable alerts and rich dashboards for real-time visibility.
Pros
- Comprehensive Observability: Integrates API monitoring with APM, infrastructure, and log management.
- Advanced Analytics: Powerful tools for root cause analysis and performance optimization.
- Scalability: Suitable for large, complex enterprise environments.
Cons
- Steeper Learning Curve: Its extensive feature set can be overwhelming for new users.
- Higher Cost: Can be more expensive than simpler, dedicated API monitoring tools.
- Resource Intensive: Requires more setup and maintenance compared to lightweight solutions.
4. Datadog
Datadog is a unified observability platform that brings together infrastructure monitoring, application performance monitoring (APM), log management, and synthetic monitoring. Its synthetic API tests are a cornerstone for ensuring the health and performance of RESTful services, making it a favorite among teams managing modern, cloud-native applications.
With Datadog, users can create multi-step API tests that mimic real-world scenarios, validating functionality and performance from various global locations. The platform's ability to correlate synthetic test results with APM data, traces, and logs provides a complete picture, allowing for rapid issue detection and resolution across the entire stack.
Key Features
- Synthetic API Tests: Multi-step tests for complex API validation from global locations.
- APM & Distributed Tracing: Correlate API performance with underlying application and infrastructure metrics.
- Comprehensive Dashboards: Customizable dashboards and advanced alerting with machine learning.
Pros
- Unified Platform: Consolidates monitoring, tracing, and logging into a single pane of glass.
- Rich Integrations: Connects with hundreds of services and cloud providers.
- AI-Powered Alerts: Intelligent anomaly detection and predictive alerting capabilities.
Cons
- Complexity: The vast array of features can be daunting for smaller teams or simpler needs.
- Pricing Structure: Can become costly for extensive usage across many features.
- Setup Overhead: Requires significant configuration to leverage its full potential.
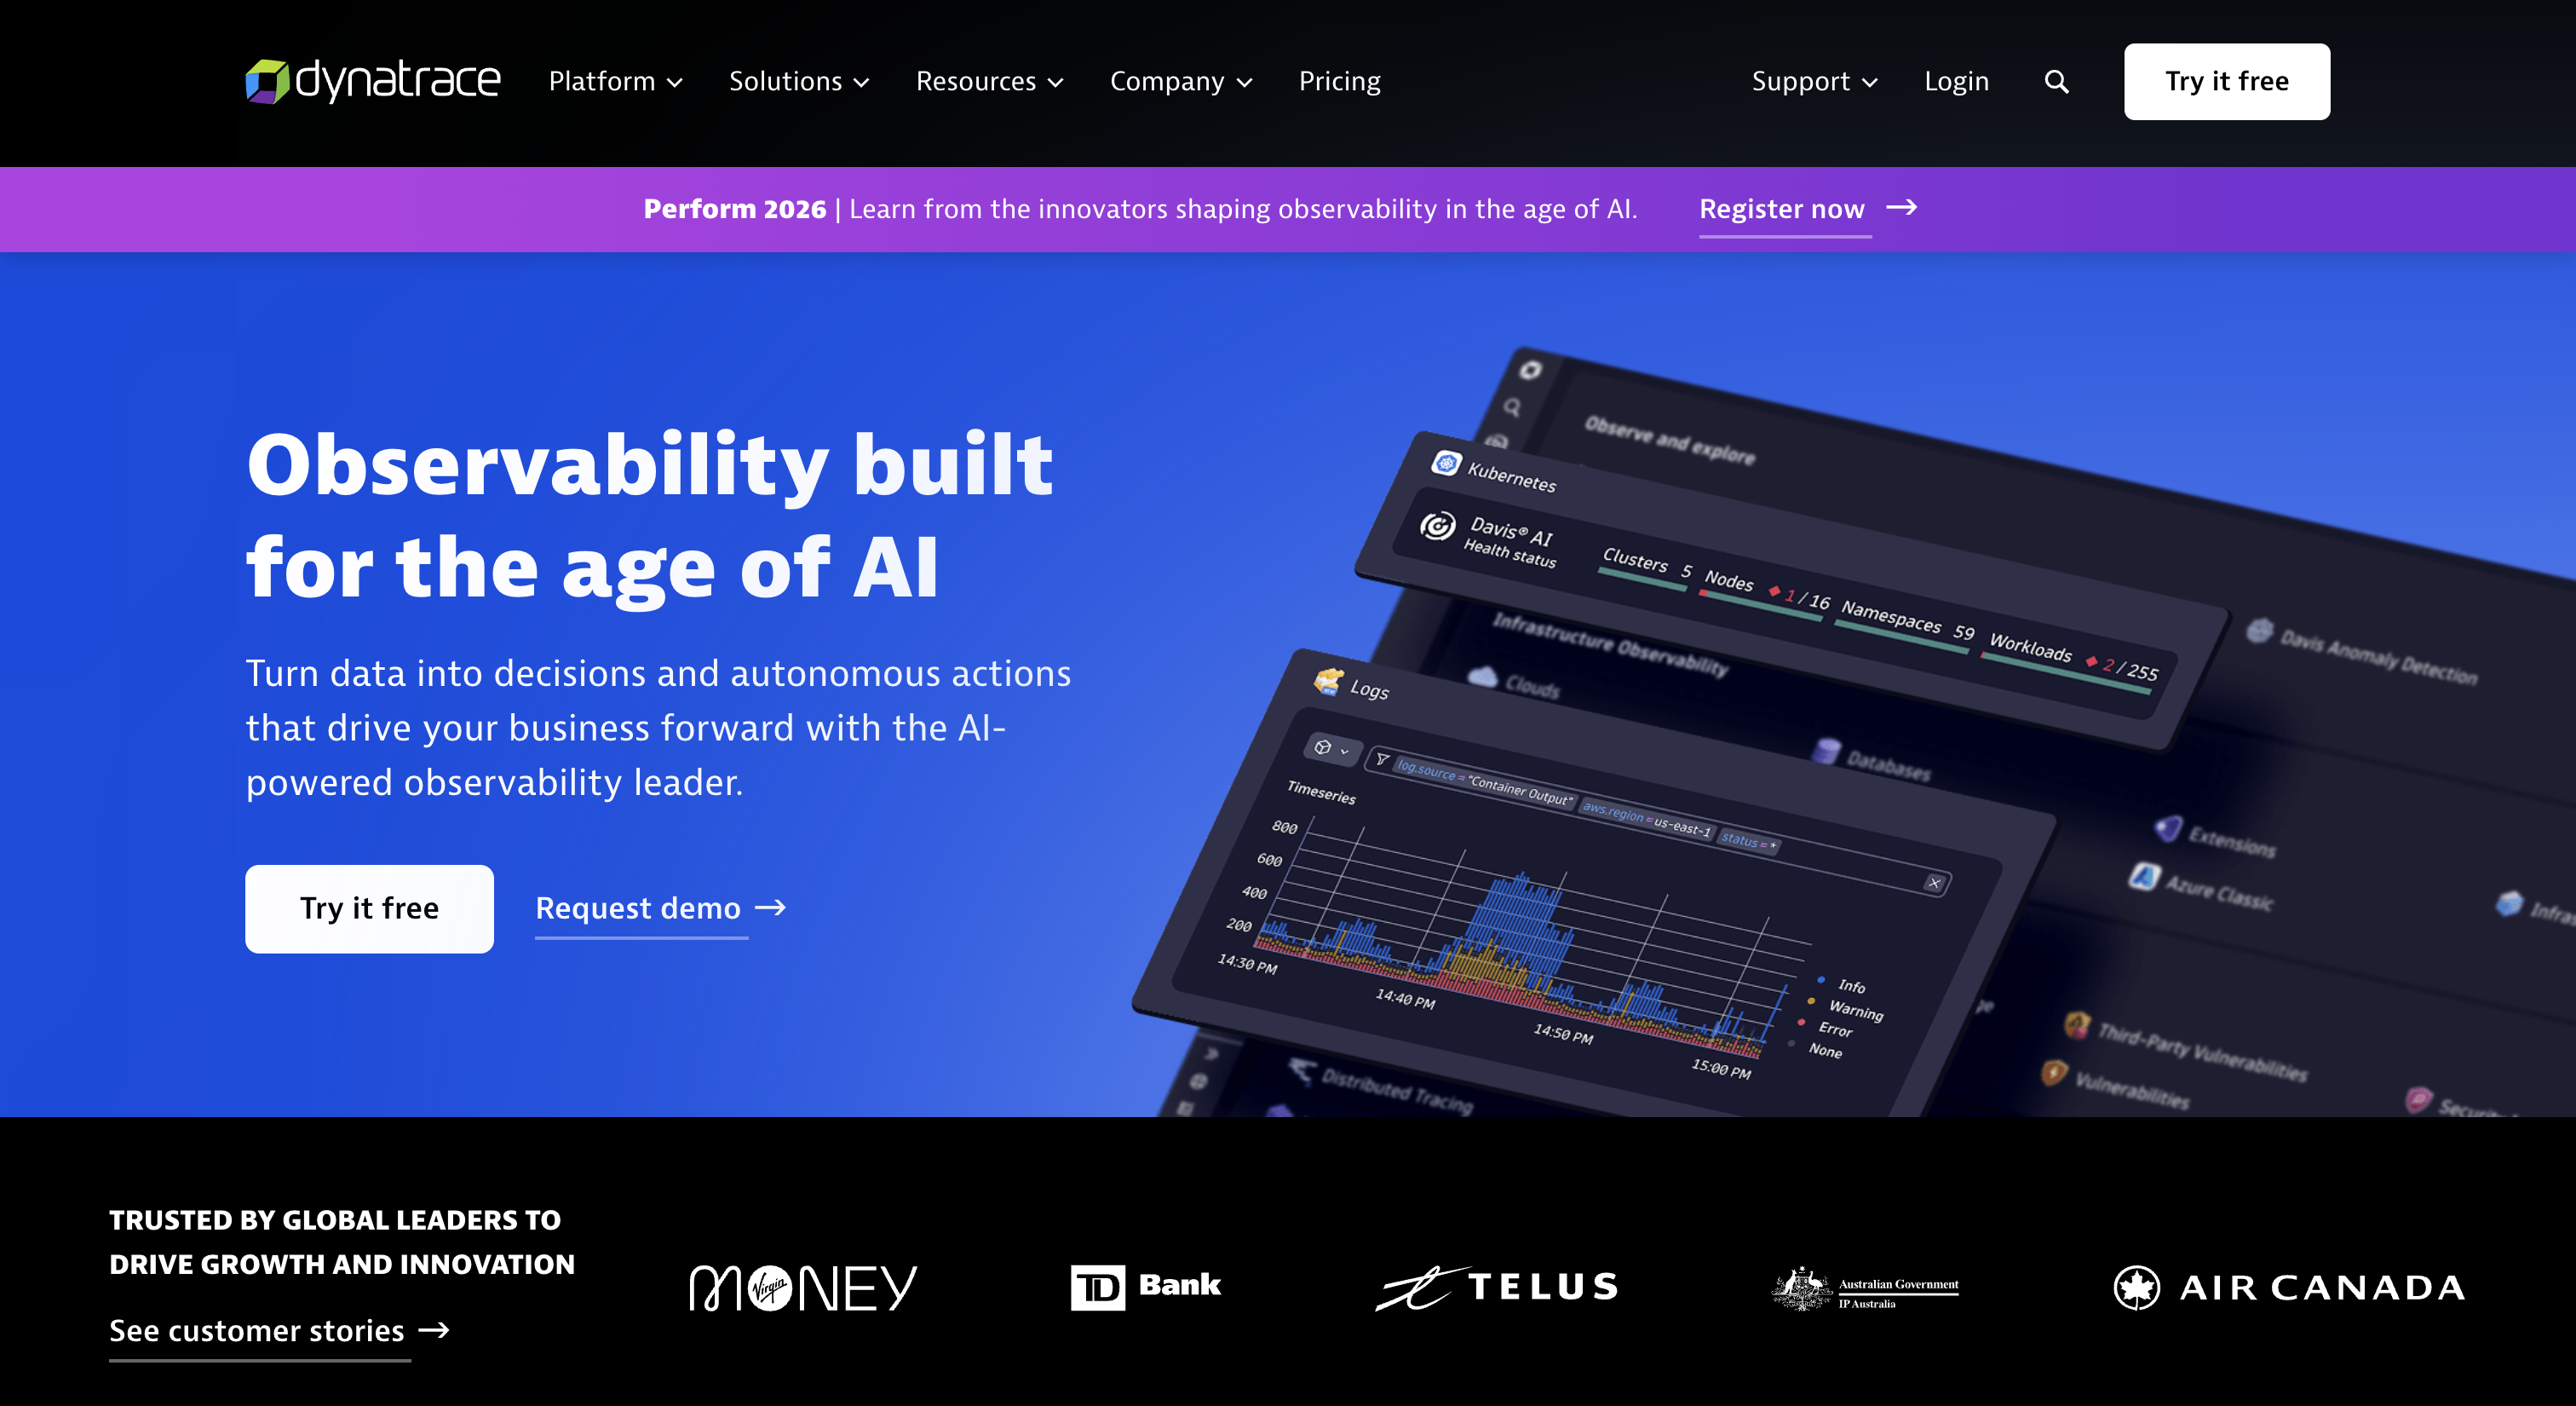
5. Dynatrace
Dynatrace provides an AI-powered, all-in-one platform for full-stack monitoring, specifically designed for highly dynamic cloud-native environments. Its robust API monitoring capabilities are deeply integrated, offering automatic and intelligent insights into the performance, availability, and user experience of REST APIs.
Leveraging its OneAgent technology, Dynatrace automatically discovers and monitors all components of your application stack, including APIs. This allows for precise root cause analysis of API issues, linking them directly to code-level problems or infrastructure bottlenecks. Dynatrace's focus on automation and AI-driven analytics simplifies the complexity of monitoring modern microservice architectures.
Key Features
- Full-Stack Observability: Automatically monitors every component interacting with APIs.
- AI-Powered Root Cause Analysis: Pinpoints API performance issues automatically.
- Synthetic Monitoring: Proactive API checks from global locations with detailed reporting.
Pros
- Deep Granularity: Provides code-level visibility into API transaction flows.
- Automation & AI: Reduces manual effort in setup, analysis, and alerting.
- Scales with Cloud-Native: Excellent for highly dynamic, containerized, and serverless environments.
Cons
- Enterprise-Focused: Designed for large organizations, potentially overkill for small teams.
- High Cost: One of the more premium options in the market.
- Initial Setup: Can require a more involved initial configuration for complex setups.
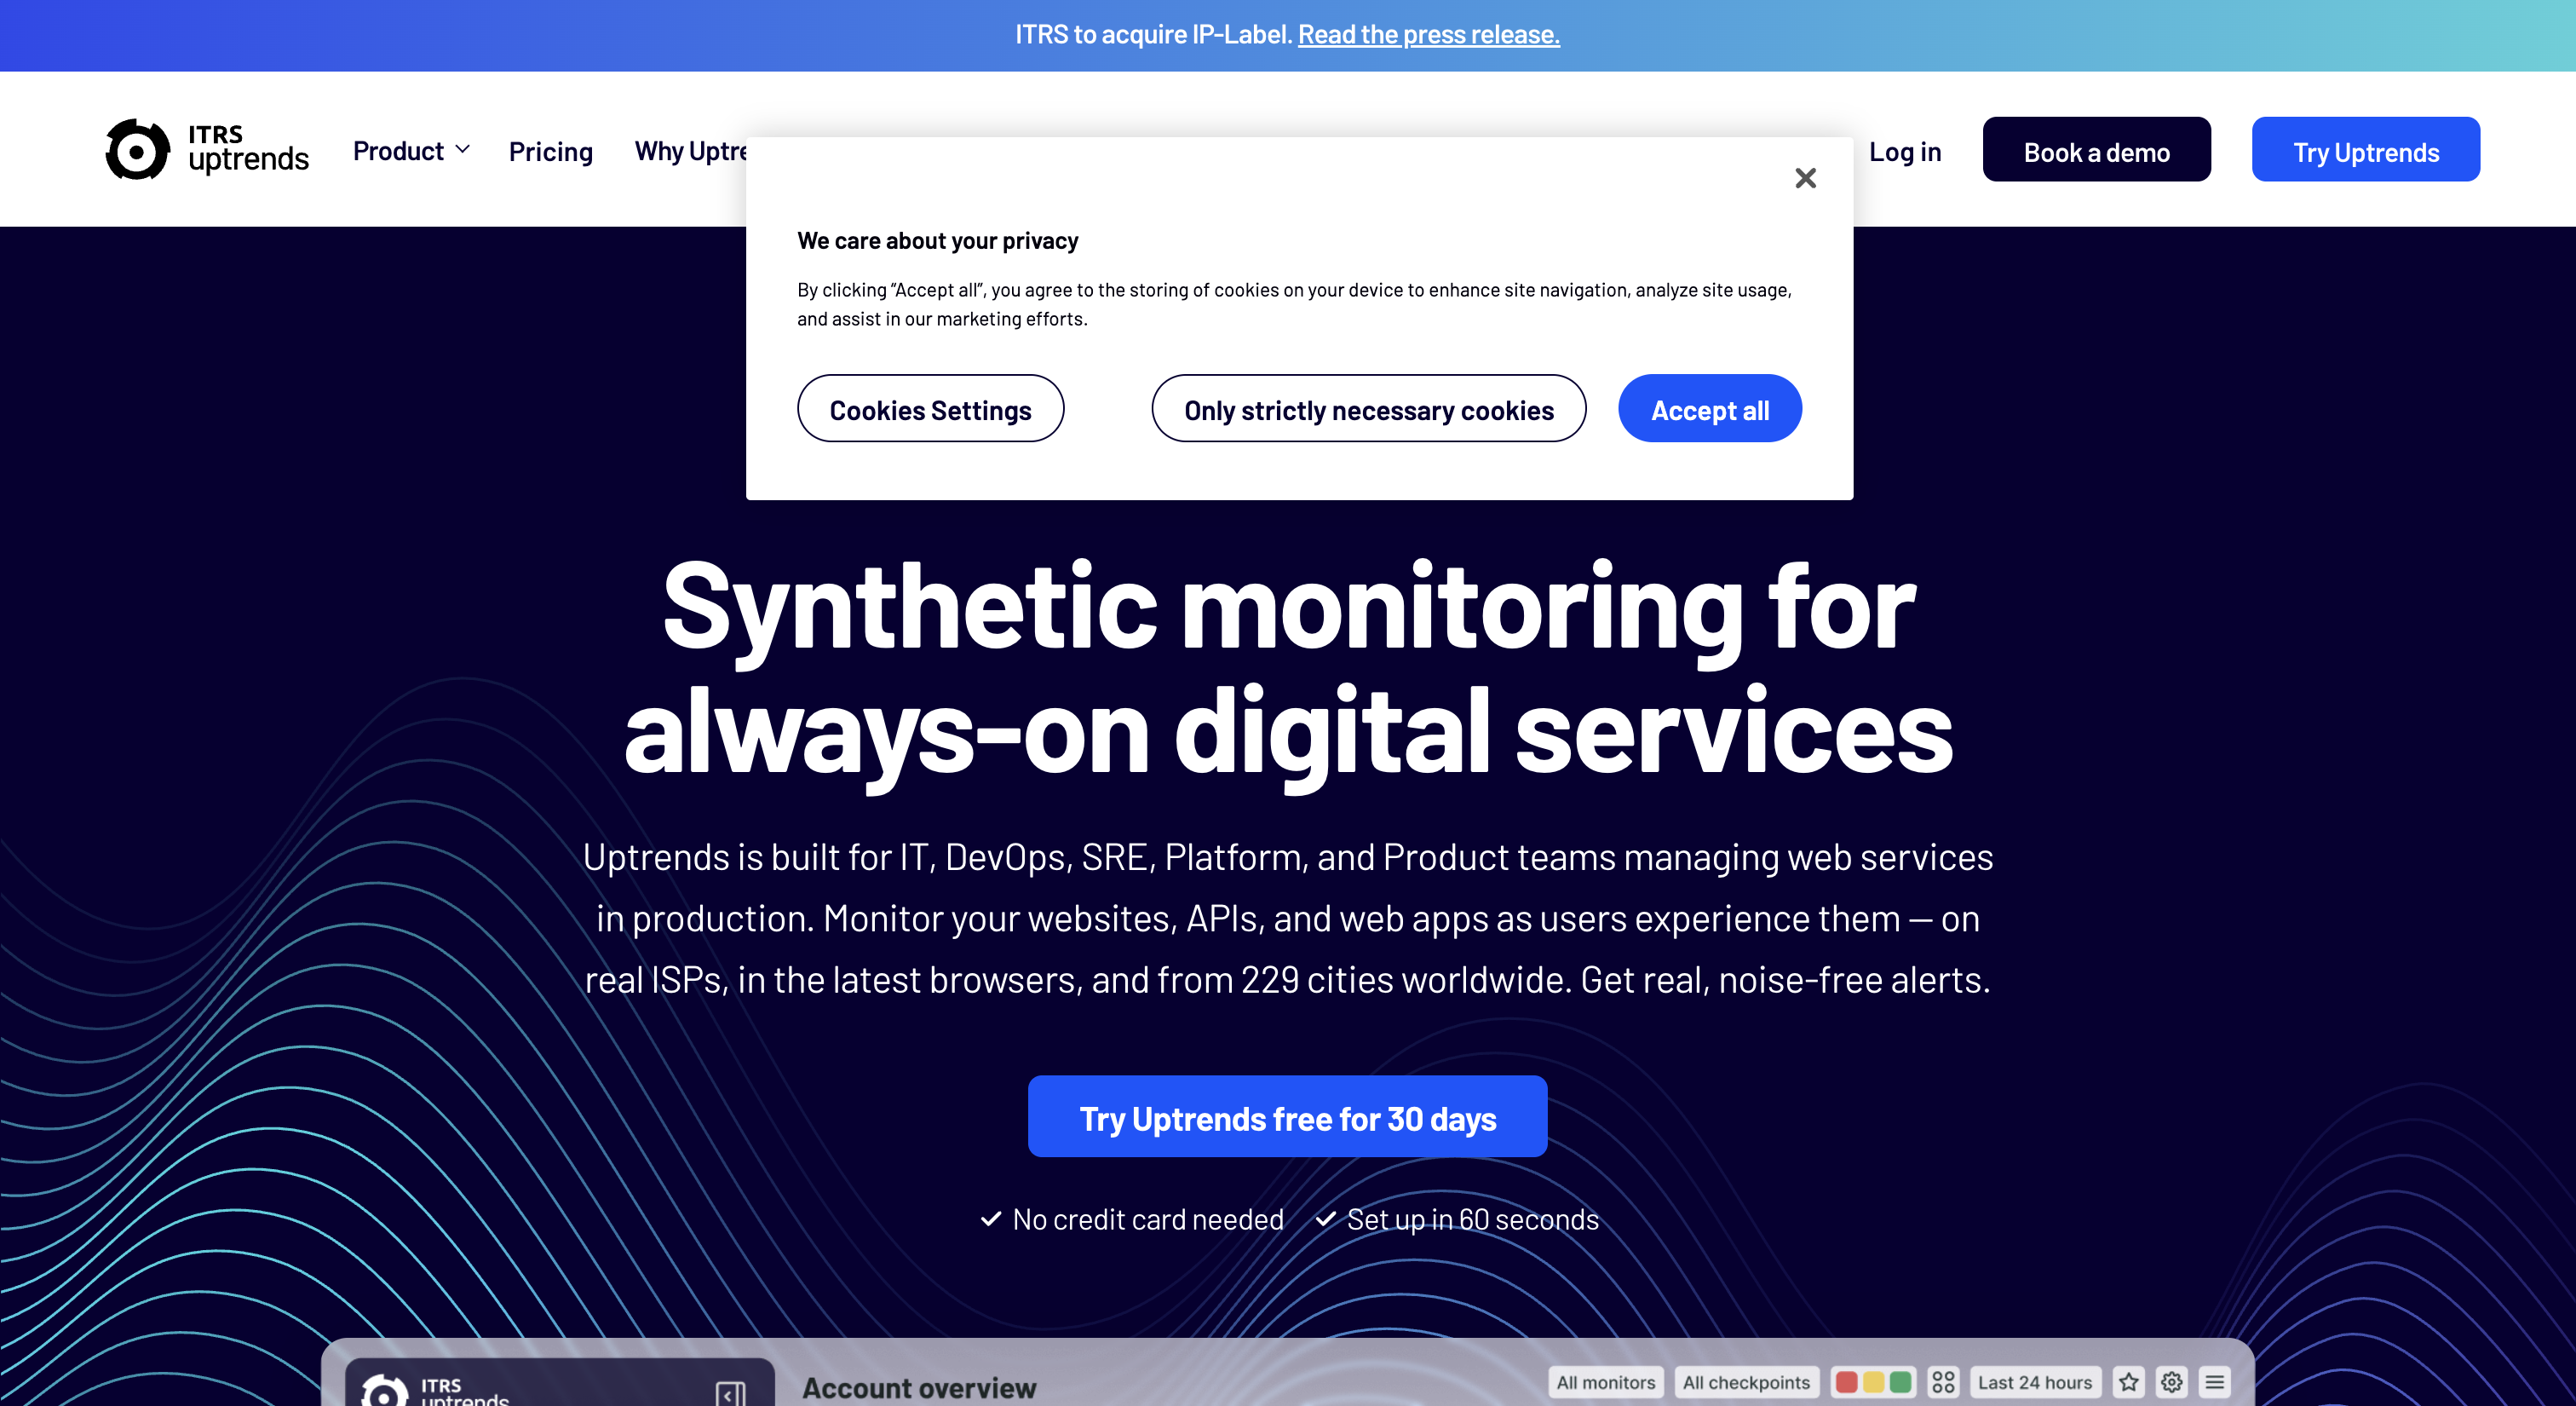
5. Uptrends
Uptrends specializes in website, server, and API monitoring, offering a strong focus on synthetic transaction monitoring from a global network of checkpoints. It's an excellent choice for businesses primarily concerned with external API uptime, performance, and user experience simulation.
The platform allows users to create detailed API monitor definitions, including authentication, custom headers, and multi-step requests. Uptrends' extensive network of monitoring stations ensures that APIs are tested from locations relevant to your user base, providing accurate insights into real-world performance and quickly alerting to any deviations.
Key Features
- Synthetic API Monitoring: Monitor REST, SOAP, and other API types from 200+ global checkpoints.
- Multi-Step API Transactions: Simulate complex user journeys involving multiple API calls.
- Detailed Performance Reports: Metrics on uptime, response time, and error rates.
Pros
- Extensive Global Network: Offers a vast number of monitoring locations worldwide.
- User-Friendly Interface: Easy to configure and manage monitors without deep technical knowledge.
- Cost-Effective for Synthetics: Provides strong synthetic monitoring capabilities at a competitive price.
Cons
- Lacks APM Depth: Does not offer full-stack APM or distributed tracing capabilities.
- Focus on External: Primarily designed for monitoring external-facing APIs rather than internal microservices.
- Limited Log Management: Not a comprehensive observability platform.
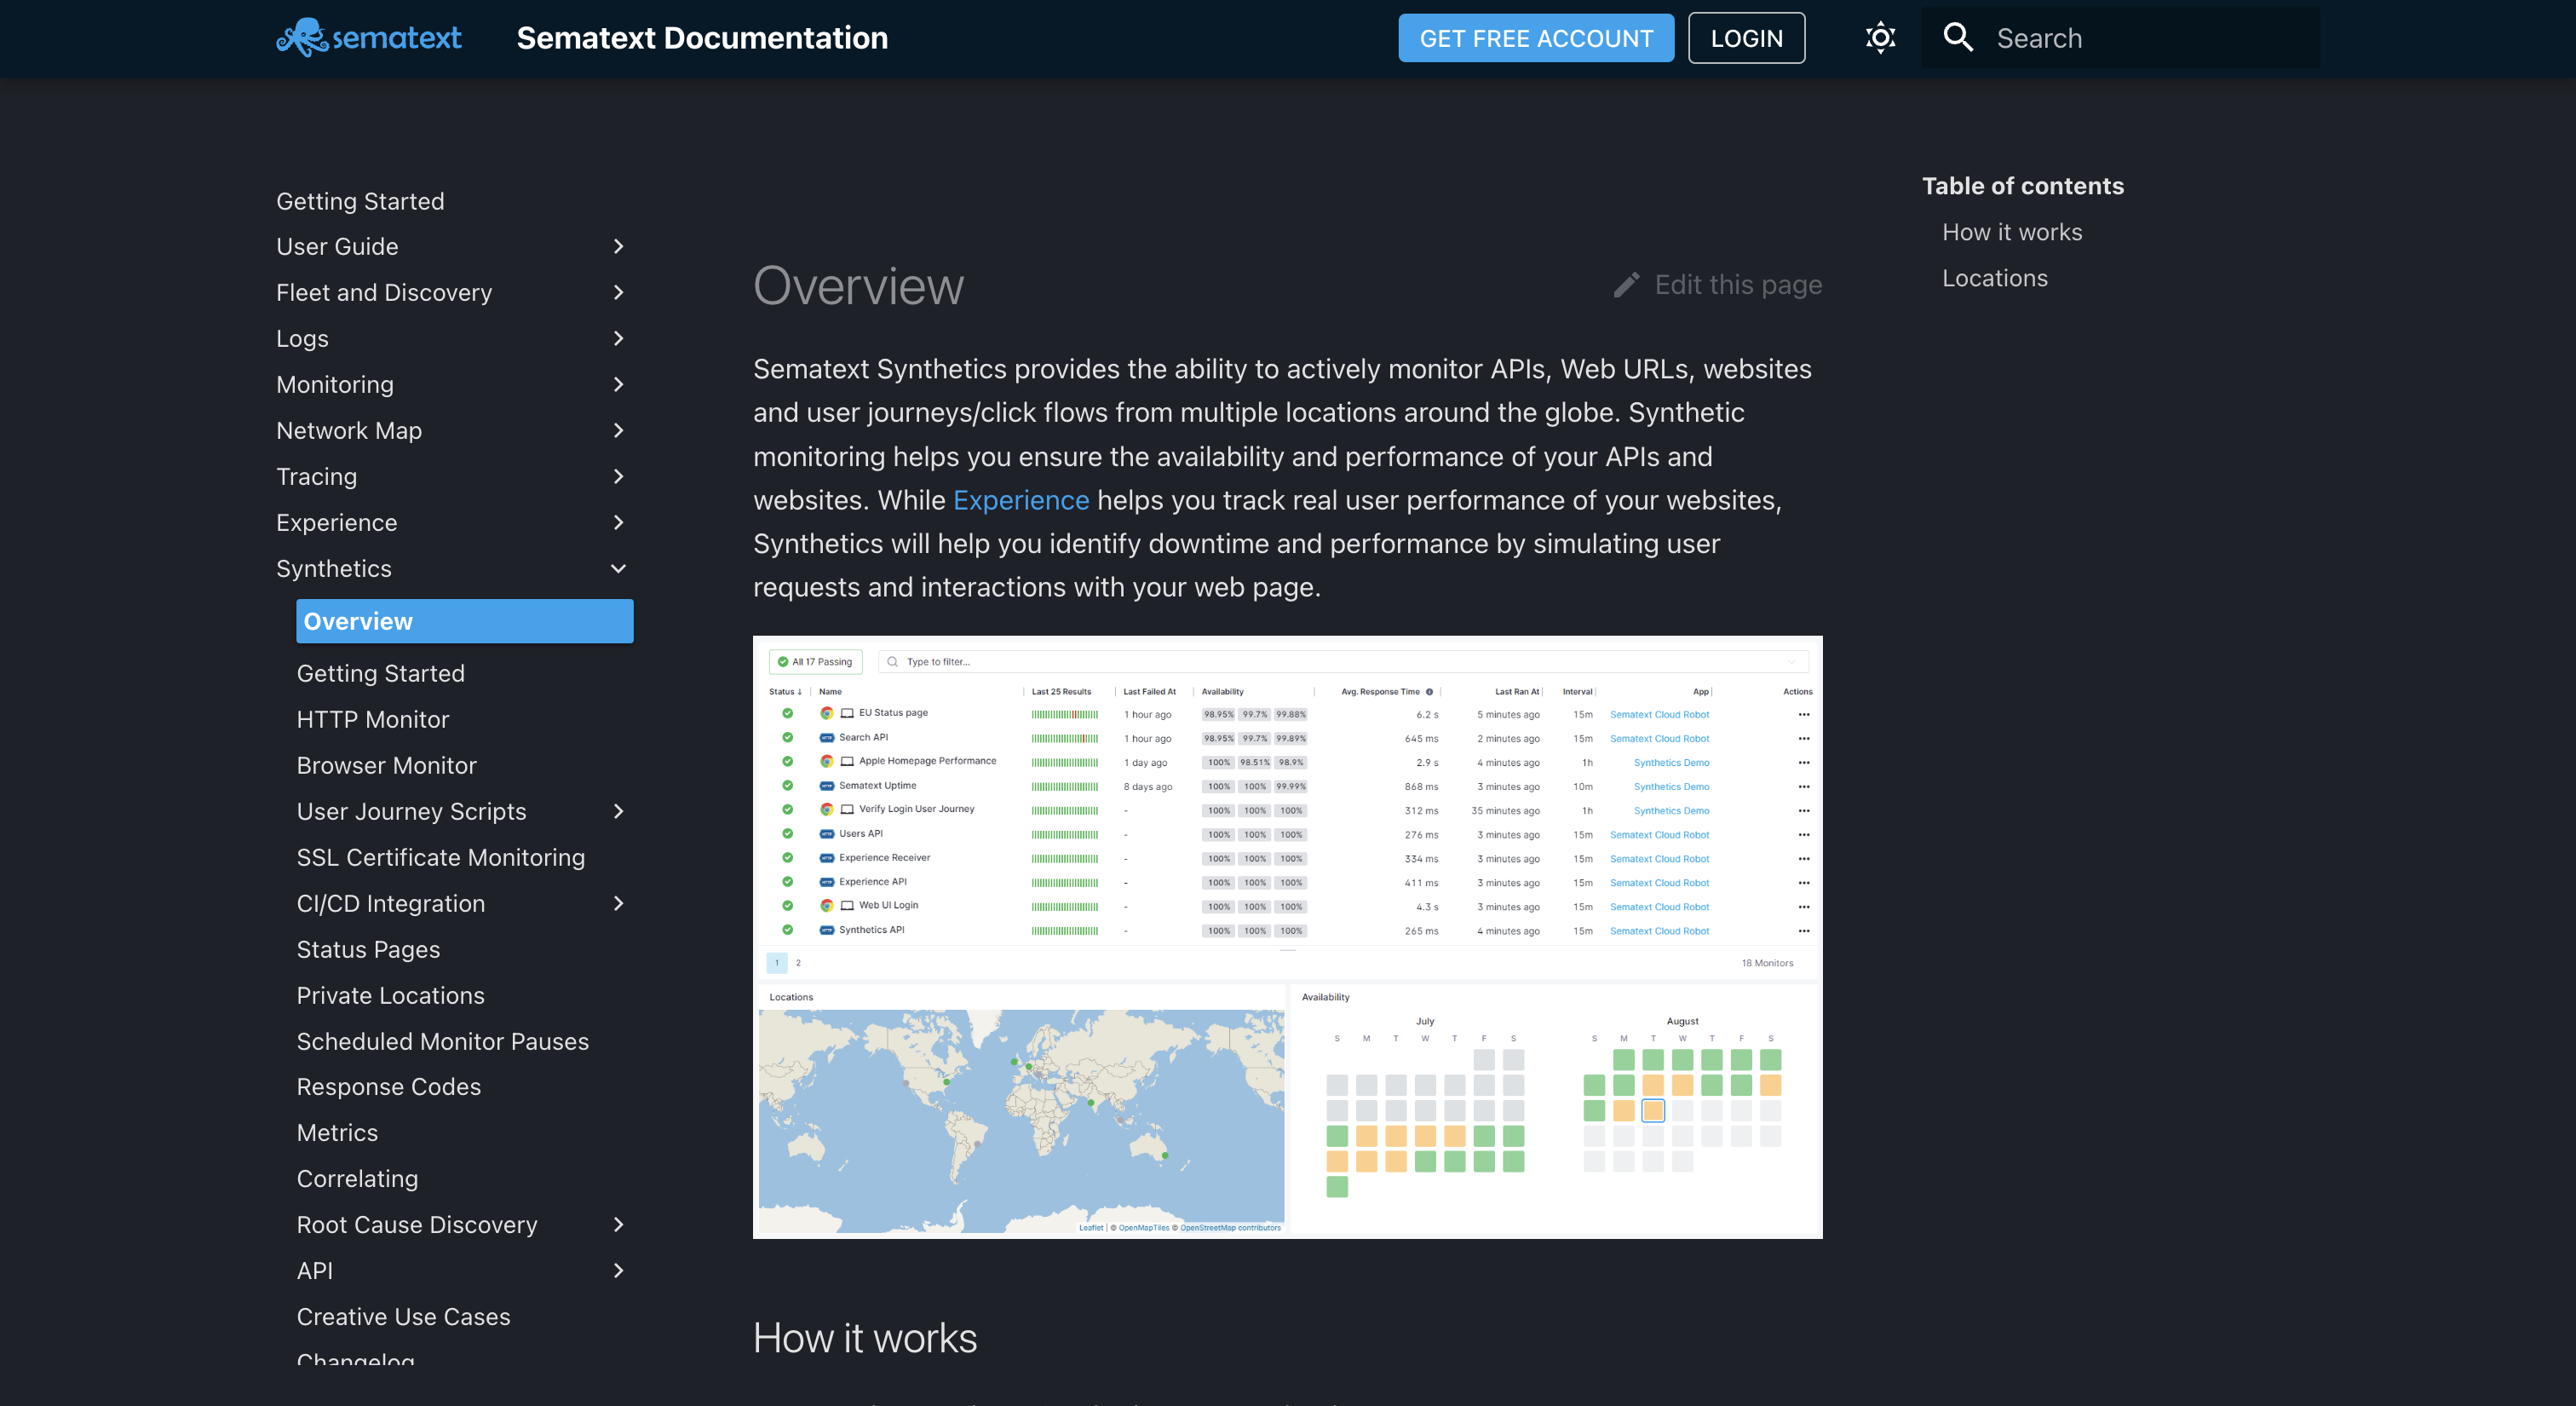
6. Sematext Synthetics
Sematext Synthetics is a comprehensive monitoring solution that combines synthetic monitoring with real user monitoring (RUM) and log management. This makes it a versatile tool for gaining a holistic view of API performance, from proactive checks to understanding actual user interactions.
For REST APIs, Sematext Synthetics allows users to create API tests that verify availability, response times, and payload validity from a global network of agents. Its integration with Sematext Cloud means that API performance data can be correlated with logs and infrastructure metrics, providing a deeper context for troubleshooting and optimization efforts.
Key Features
- Multi-Protocol API Checks: Supports REST, SOAP, and other API types for comprehensive monitoring.
- Advanced Assertions: Validate JSON/XML responses, status codes, and headers.
- Unified Observability: Integrates with Sematext Logs and APM for full-stack insights.
Pros
- Flexible Pricing: Pay-as-you-go model allows for scalability and cost control.
- Correlation Capabilities: Easily link synthetic API results with logs and metrics for faster debugging.
- Developer-Friendly: Provides powerful REST API for integration and automation.
Cons
- User Interface: Can be less intuitive compared to some highly polished competitors.
- Learning Curve: Requires some familiarity with observability concepts to fully leverage.
- Smaller Agent Network: Global monitoring locations might be less extensive than market leaders.
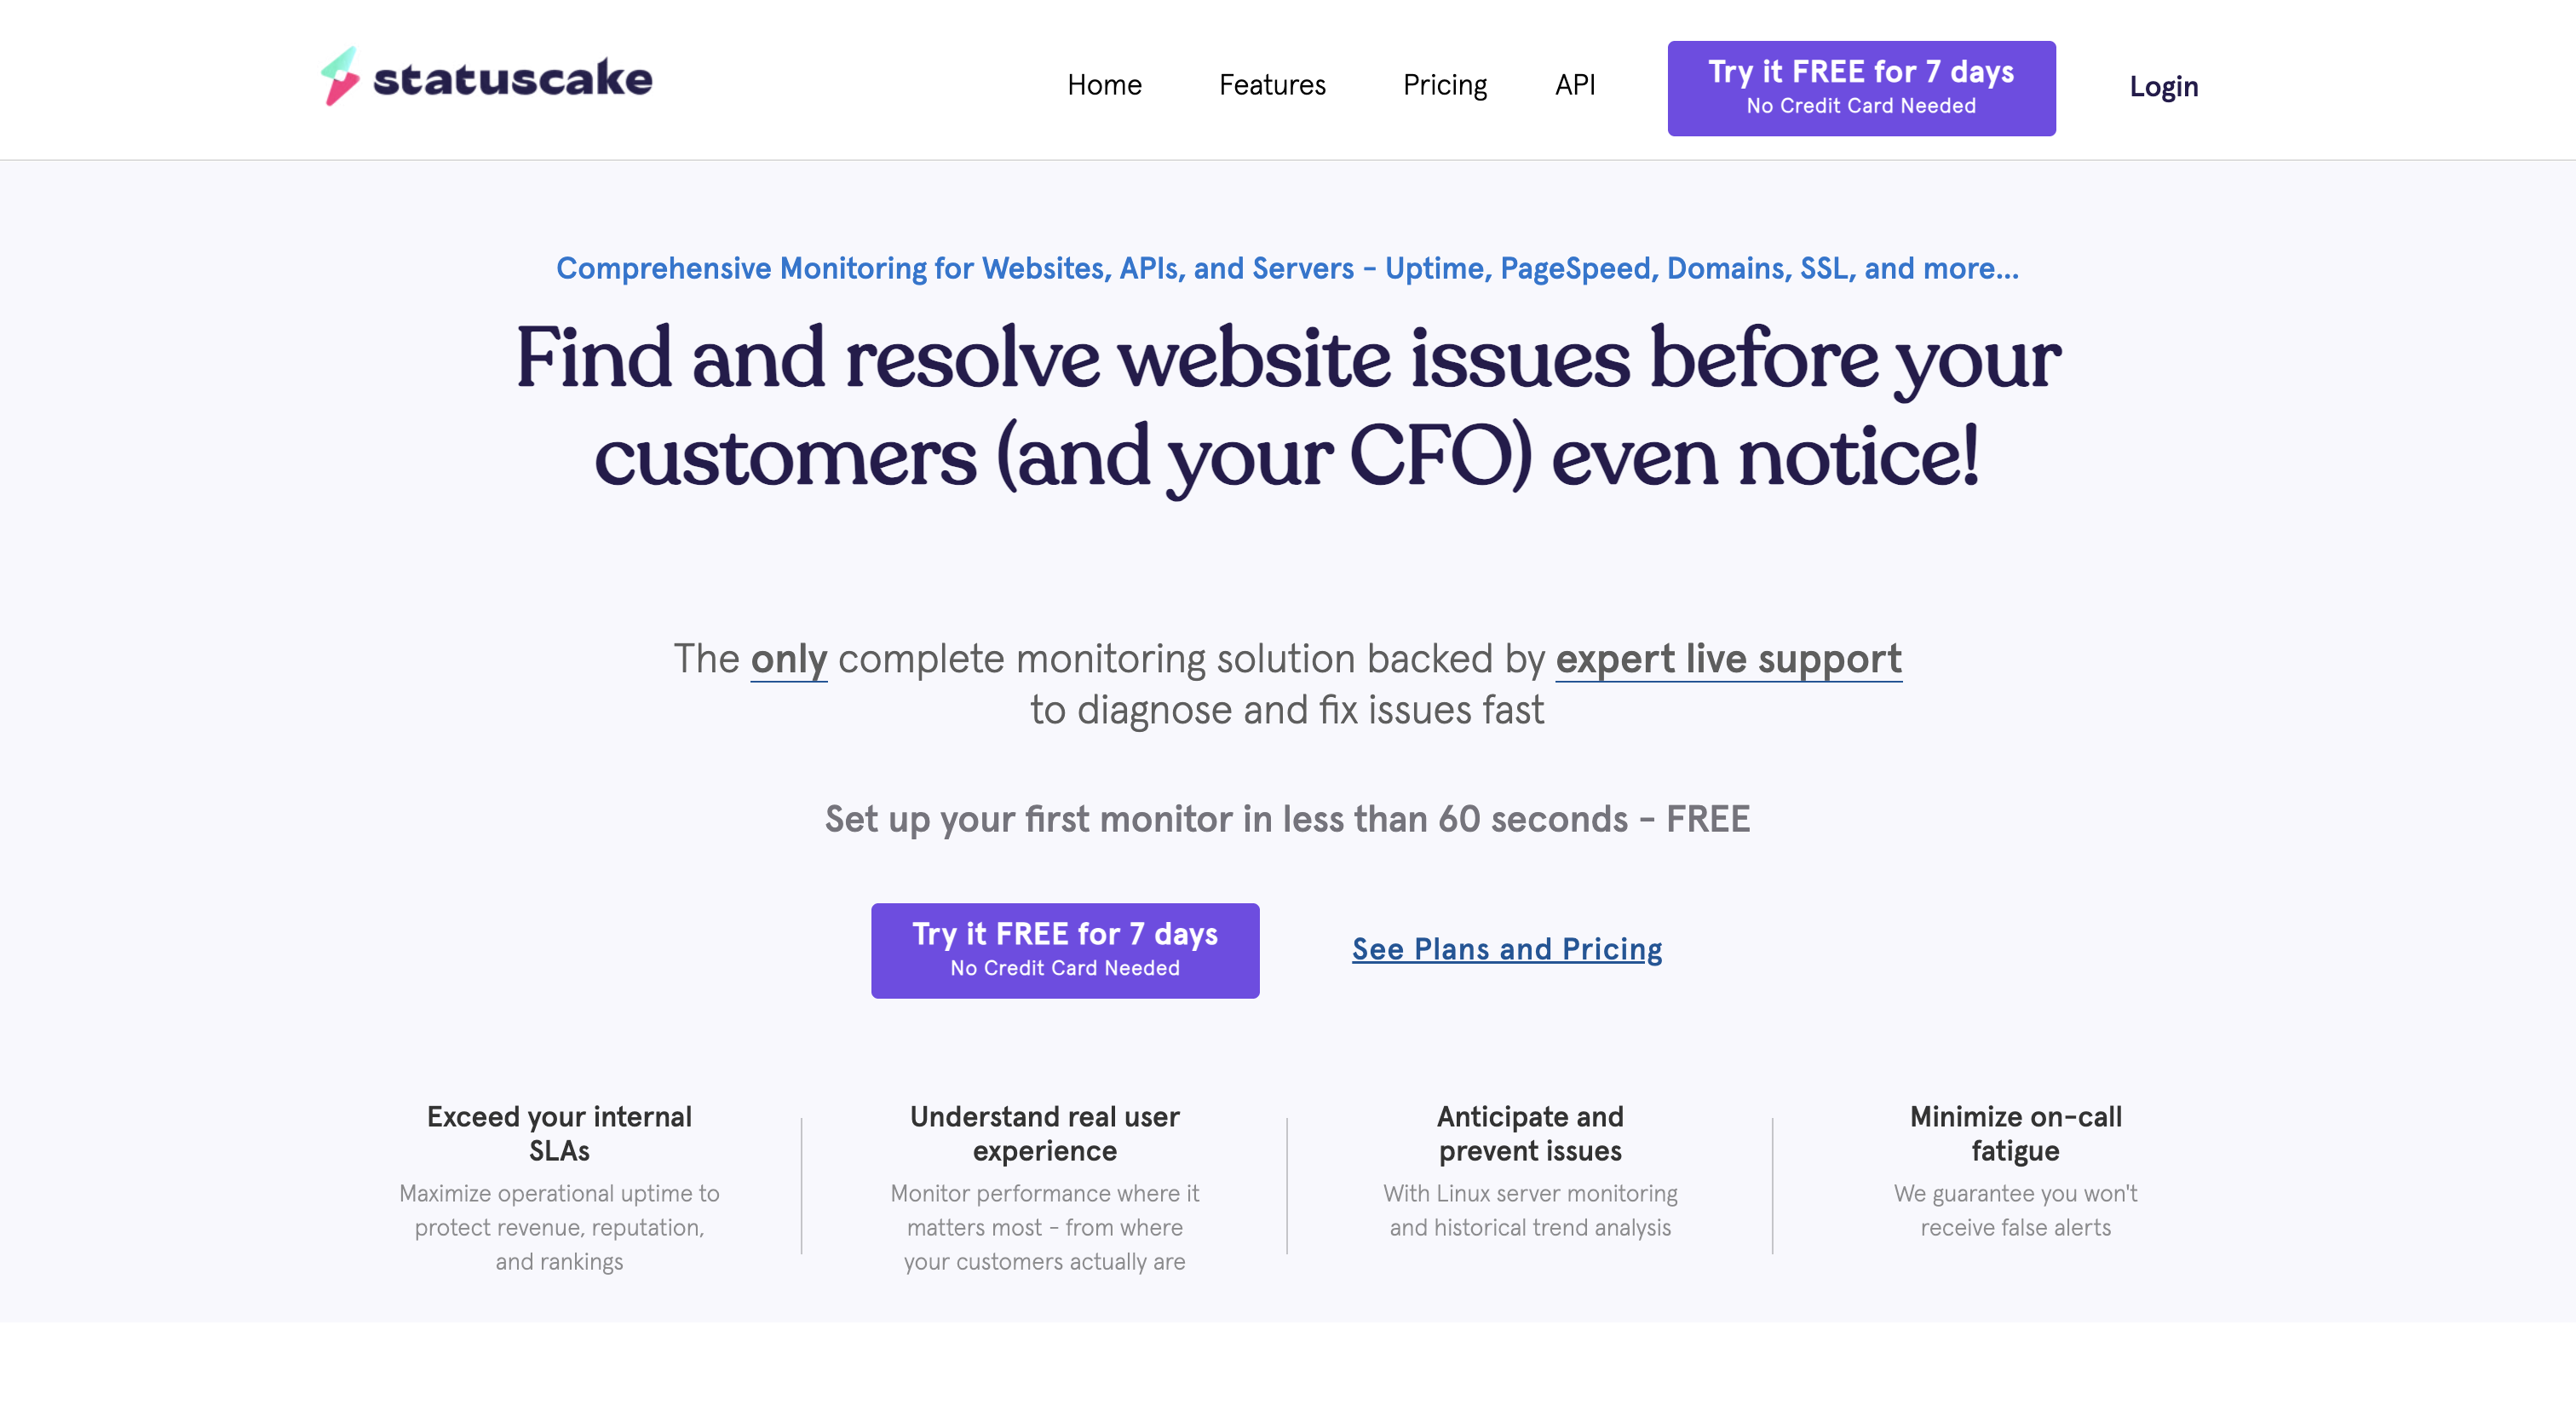
8. StatusCake
StatusCake offers an accessible and feature-rich monitoring platform focused on website and API uptime. It's designed for users who need reliable and easy-to-configure checks for their REST APIs without the complexity of a full-blown APM solution, making it suitable for small to medium-sized businesses.
The tool provides HTTP monitors that can be configured to check specific API endpoints, validating response codes, content, and headers. With monitoring locations spread across the globe and various alerting options, StatusCake ensures that any API degradation or downtime is detected promptly, allowing teams to react quickly to maintain service availability.
Key Features
- HTTP Monitors: Check API endpoints for uptime, status codes, and response content.
- Global Monitoring Locations: Test APIs from over 40 global nodes.
- Instant Alerts: Get notified via email, SMS, Slack, webhooks, and more.
Pros
- User-Friendly: Simple interface makes it easy to set up and manage monitors.
- Good Value: Offers a strong set of features for its price point, including a free tier.
- Reliable Alerting: Robust notification system for critical incidents.
Cons
- Limited Advanced Features: Lacks deep diagnostic tools like distributed tracing or code-level insights.
- Synthetic Only: Does not offer real user monitoring or full-stack APM.
- Less Scalable for Enterprise: Might not meet the complex requirements of very large organizations.
9. Site24x7
Site24x7 is an all-in-one monitoring solution from Zoho that offers a broad spectrum of capabilities, including website monitoring, server monitoring, cloud monitoring, and comprehensive application performance monitoring (APM). Its REST API monitoring feature is an integral part of this holistic approach, providing vital insights into service health and performance.
With Site24x7, users can monitor REST APIs for uptime, response time, and content verification from multiple global locations. The platform supports complex API scenarios, including authentication and parameter passing, and allows for the correlation of API metrics with other application components, aiding in quicker root cause analysis and resolution.
Key Features
- REST API Monitoring: Checks availability, response time, and content for REST endpoints.
- Multi-Location Tests: Proactive monitoring from over 120 global locations.
- Full-Stack Integration: Correlates API performance with APM, server, and cloud metrics.
Pros
- Comprehensive Solution: Covers a wide range of monitoring needs beyond just APIs.
- Flexible Configuration: Supports various authentication methods and request types.
- Affordable for Bundled Features: Good value for a platform offering extensive capabilities.
Cons
- Interface Can Be Cluttered: The vast feature set can make the UI feel complex at times.
- Learning Curve: New users might need time to navigate and utilize all functionalities.
- Reporting Depth: While extensive, specific API-focused reports may require customization.
10. AppDynamics
AppDynamics, now part of Cisco, is a powerful application performance monitoring (APM) platform designed for complex enterprise environments. It offers deep, end-to-end visibility into application health, including granular monitoring of REST APIs as they interact with various services and databases.
AppDynamics provides not only synthetic monitoring for proactive API checks but also leverages its robust agent technology to trace API calls through the entire application stack. This allows teams to precisely identify performance bottlenecks, error sources, and dependencies that impact API responsiveness, making it invaluable for mission-critical applications.
Key Features
- End-to-End Transaction Tracing: Follow API requests through complex distributed systems.
- Business Transaction Monitoring: Link API performance directly to business outcomes.
- Synthetic Monitoring: Proactive checks of API availability and performance from various locations.
Pros
- Deep Code-Level Visibility: Offers unparalleled insights into API execution and dependencies.
- Business Context: Connects technical performance metrics to business impact.
- Enterprise-Grade Scalability: Built for the most demanding and complex application landscapes.
Cons
- High Cost: One of the most expensive solutions, typically for large enterprises.
- Complex Implementation: Requires significant setup and configuration for full functionality.
- Resource Intensive: Can have a higher overhead compared to simpler monitoring tools.
Conclusion
The success of modern applications hinges on the unwavering performance and availability of their underlying REST APIs. Investing in robust API monitoring tools is not merely a technical decision; it's a strategic imperative for safeguarding user experience, protecting business continuity, and fostering innovation. From synthetic checks that simulate user journeys to deep APM insights that pinpoint code-level issues, the right monitoring solution empowers teams to stay ahead of problems.
The diverse landscape of tools available means there's an ideal fit for every organization, whether you prioritize simplicity and cost-effectiveness or require enterprise-grade, AI-powered observability. By leveraging these top REST monitoring tools, businesses can ensure their APIs remain reliable, responsive, and ready to meet the demands of an ever-evolving digital world.
FAQs
What is REST API monitoring?
REST API monitoring involves continuously tracking the performance, availability, and correctness of your RESTful APIs. This includes checking metrics like response time, uptime, error rates, and data integrity from various geographical locations, often through synthetic requests that simulate user interactions, to ensure they are functioning as expected.
Why is monitoring REST APIs important?
Monitoring REST APIs is crucial because these interfaces are often the backbone of applications and services. Downtime or poor performance in an API can lead to application failures, degraded user experience, loss of revenue, and reputational damage. Proactive monitoring helps identify and resolve issues quickly, ensuring continuous service delivery.
What are the key metrics to monitor for REST APIs?
Key metrics for REST API monitoring include uptime/availability (is the API reachable?), response time (how quickly does it respond?), error rates (how many requests fail?), throughput (how many requests can it handle per second?), and data validation (is the API returning the correct data?). Monitoring these provides a comprehensive view of API health.
What's the difference between synthetic and real user monitoring for APIs?
Synthetic monitoring proactively simulates API calls from predefined locations at regular intervals, providing a controlled baseline for performance and uptime. Real User Monitoring (RUM), on the other hand, captures data from actual user interactions with APIs through your applications. While RUM gives insight into real-world experiences, synthetic monitoring is vital for proactive issue detection and performance benchmarking.
How do I choose the best REST API monitoring tool?
Choosing the best tool depends on your specific needs, budget, and existing infrastructure. Consider factors like ease of setup, global monitoring locations, alerting capabilities, integration with your current tools (CI/CD, incident management), the depth of analytics required (simple uptime vs. full-stack APM), and scalability. Assess whether you need a dedicated synthetic tool or a comprehensive observability platform.
Dhayalan Subramanian is Associate Director, Product Growth at DigitalAPI, where he leads go-to-market and product growth for the company’s multi-gateway API management platform. His work focuses on helping large enterprises and mid-market cloud companies consolidate APIs across AWS, Azure, Apigee, Kong, MuleSoft, and other gateways into a single control plane for governance, discovery, monetization, and agent consumption.
Dhayalan brings 14+ years of experience across product strategy, enterprise architecture, and engineering leadership. Earlier in his career, he held senior roles at Encora (as Associate Architect and Technical Manager), Mindtree (Technology Lead), Tech Mahindra (Technical Lead), and Primus Analytics, where he designed integration frameworks and delivered enterprise-grade digital platforms for global customers.
At DigitalAPI, he works directly with platform, integration, and developer experience leaders at Fortune 500 organizations to operationalize unified API catalogs, developer portals, and MCP-ready APIs. He writes regularly on API developer experience, API governance, and AI agent architectures.

One email a fortnight. Worth opening.
A short digest of what we're writing, what we're learning from customers, and the handful of links you'd actually want from us. No tracking pixels.
.avif)