




%20(1).svg)
API Analytics
API Analytics and Intelligence
Understand your entire API estate in one place. DigitalAPI unifies analytics across Apigee, Kong, AWS, and Azure, so you can see what APIs exist, how they are performing, who is using them, and where value is being created, across every gateway, cloud, and consumer.
ISO 27001 certified
Recognized by Gartner


Trusted by 240+ API teams
From cloud-first banks to global telcos









Definition
What is API analytics?
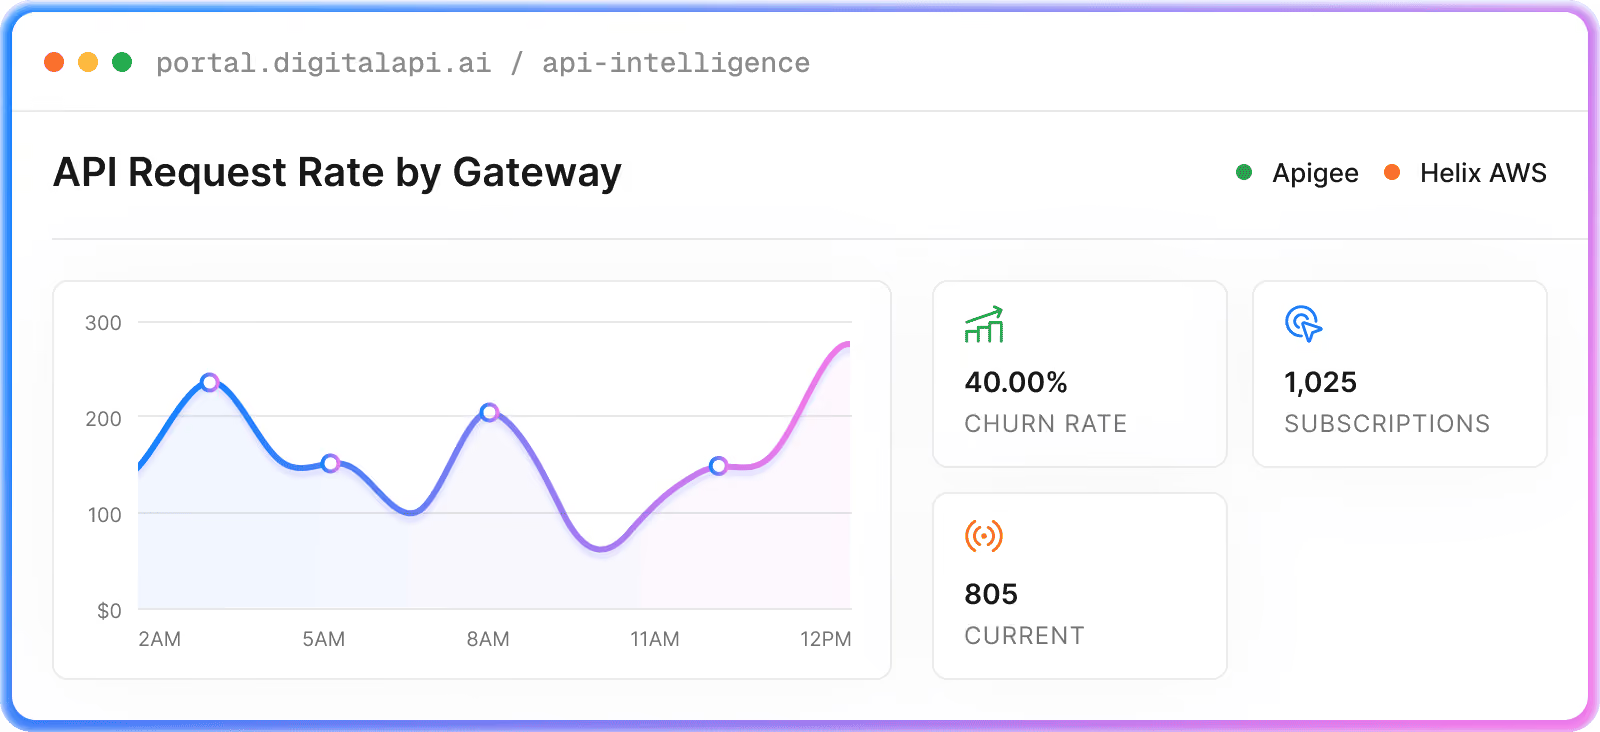
API analytics is the practice of collecting, measuring, and interpreting data about how APIs are used and how they perform. It turns raw traffic and logs into insight: which APIs exist, how fast and reliable they are, who is consuming them, and what business value they create, so teams can improve quality, adoption, and revenue.
Done well, it spans both sides of the picture: operational signals like latency, errors, and uptime, and business signals like adoption, top consumers, and usage-driven value, in one view across every gateway.
Monitoring
Answers is it healthy right now? Uptime, response time, and error alerts, focused on operational status.
Analytics
Answers what is happening and why? Usage trends, adoption, consumers, and value over time. DigitalAPI does both.
How it works
How does API analytics work with DigitalAPI?
You go from scattered, per-gateway metrics to one estate-wide view in four steps, with no separate analytics stack to build or maintain.
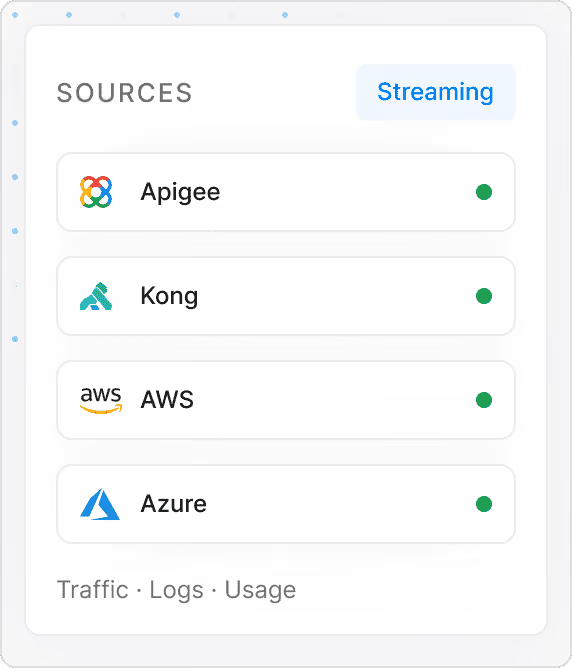
Connect every gateway and source
Stream traffic, logs, and usage from Apigee, Kong, AWS, and Azure, with no per-API instrumentation and no separate pipeline to run.
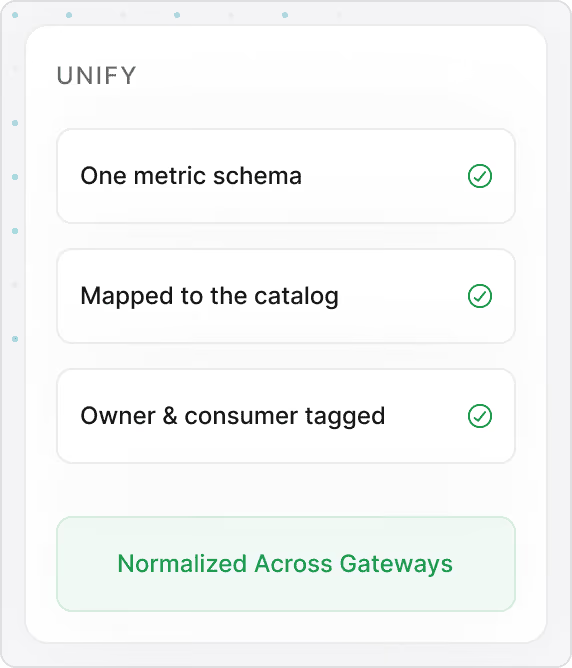
Unify and normalize the metrics
Different gateways report differently. DigitalAPI normalizes everything into one schema and maps each metric to a known API, owner, and consumer.
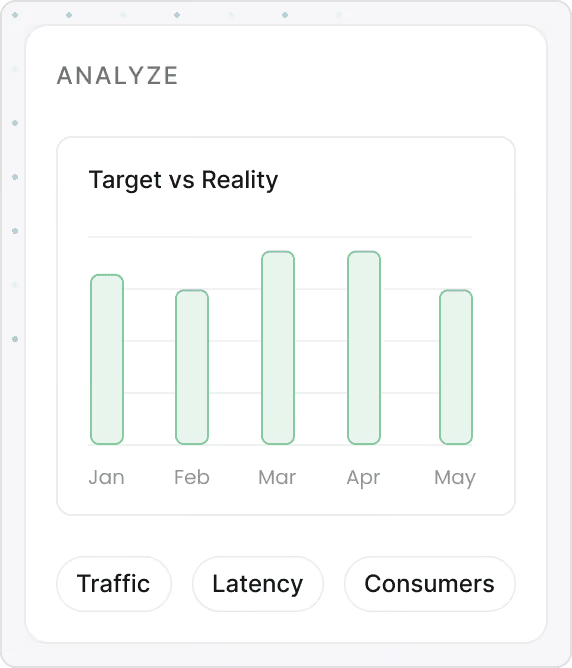
Analyze performance, usage, and consumers
Explore dashboards for traffic, latency, errors, adoption, and top consumers, then drill from estate-wide trends down to a single request.
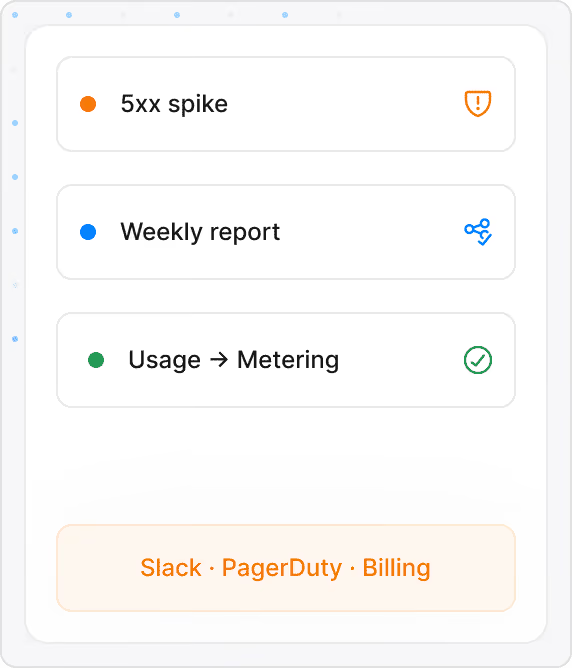
Act: alert, report, and feed monetization
Route anomaly alerts to Slack or PagerDuty, share reports with stakeholders, and pass usage straight into metering, billing, and governance.
What it answers
The four questions great API analytics answers
Strong API analytics serves four audiences at once: the API team, operations, the business, and the developers consuming your APIs. It comes down to four questions, and DigitalAPI answers all of them in one place.

What APIs exist?
See your full estate and how it changes, mapped to the live catalog across every gateway.

How are they performing?
Track operational health so you catch issues before consumers feel them.

Who is using them?
Understand adoption at the consumer and endpoint level, and who your power users are.

Where is value created?
Connect usage to outcomes, the data that drives metering, billing, and roadmap calls.
Why DigitalAPI
Why choose DigitalAPI for API analytics?
Single-gateway dashboards only see their own slice, and product analytics tools are wired API by API. DigitalAPI is one analytics layer across your whole estate, joining operational and business signals and mapping every metric back to the catalog.
.svg)
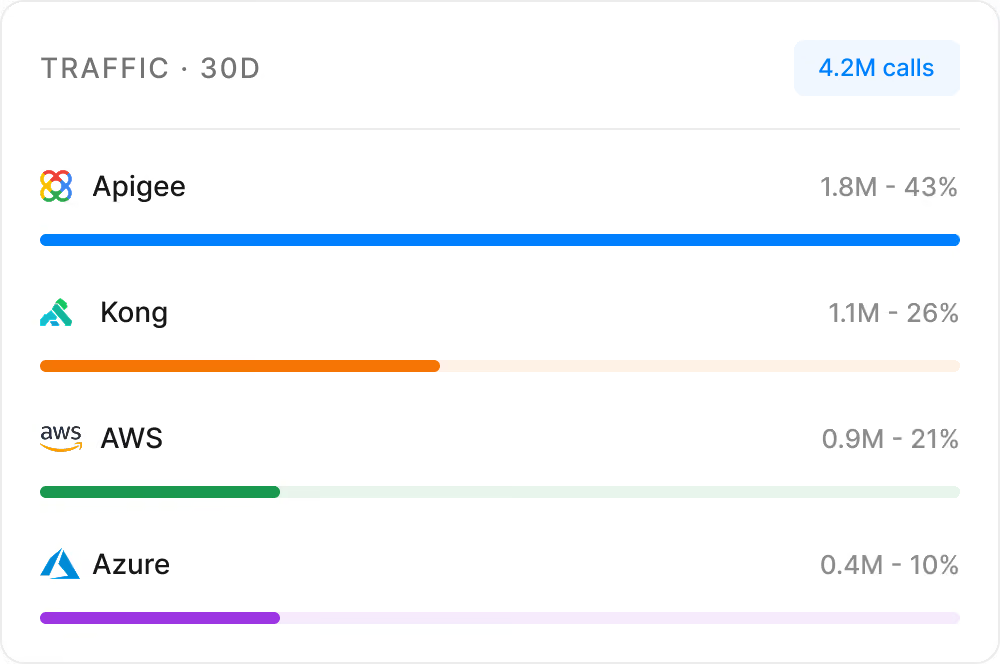
Unified analytics across every gateway
One place to measure APIs on Apigee, Kong, AWS, and Azure, instead of stitching together separate per-gateway dashboards.
.svg)
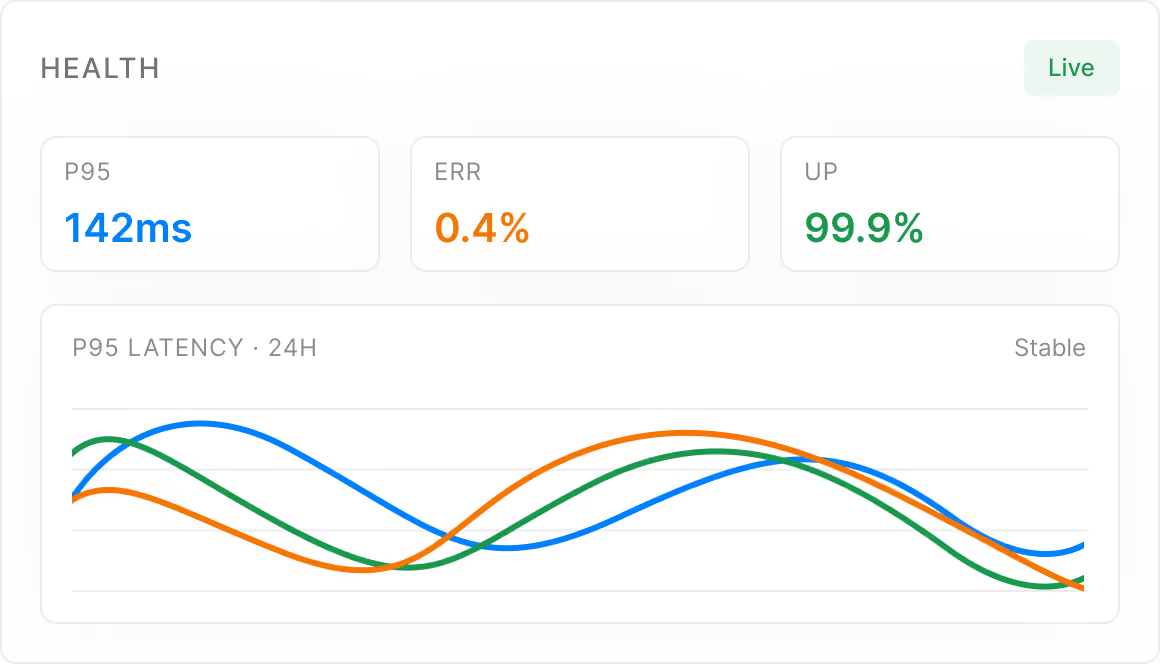
Operational health at a glance
Latency (including p95 and p99), error rates, throughput, and uptime per API and per gateway, so you catch problems before consumers do.
.svg)
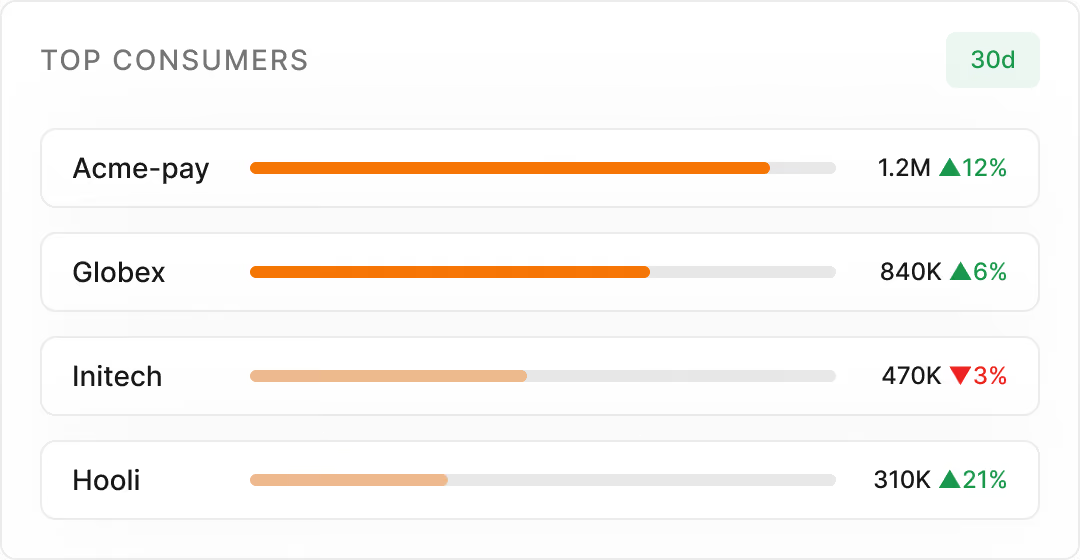
Usage and adoption insight
See which APIs and endpoints are growing, who your top consumers are, and where adoption is stalling, down to the individual app.
.svg)
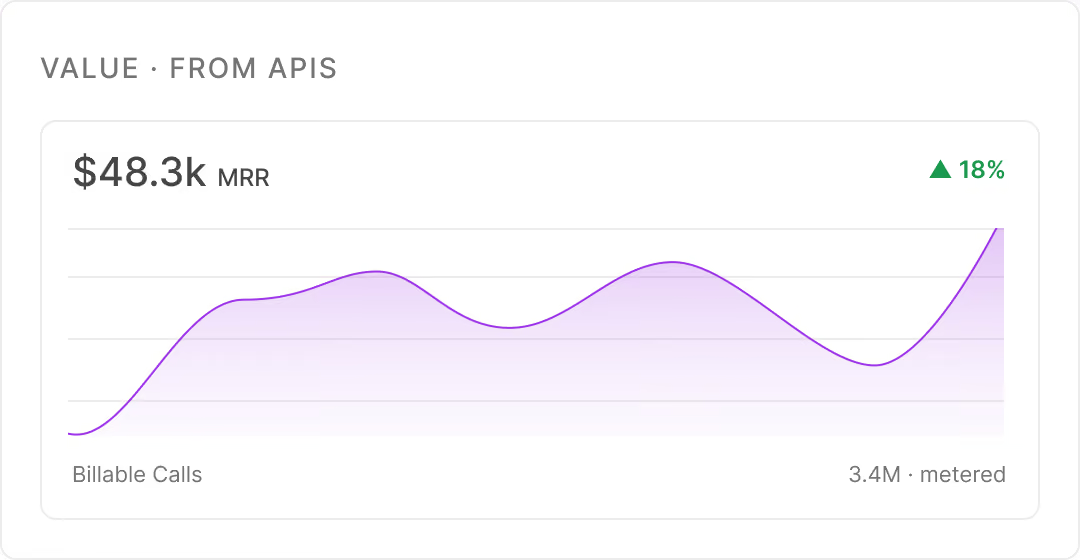
Business value and revenue insight
Connect usage to outcomes and feed it straight into metering and billing, so analytics drives revenue, not just dashboards.
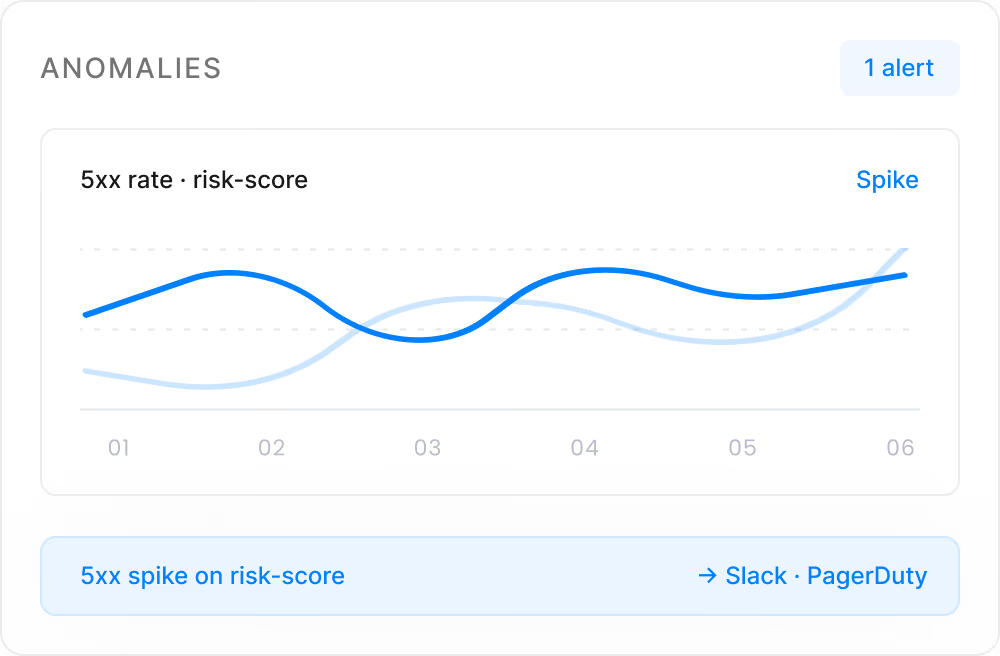
Anomaly detection and alerts
Spot error spikes, latency regressions, and unusual traffic automatically, and route alerts to Slack, PagerDuty, or email.
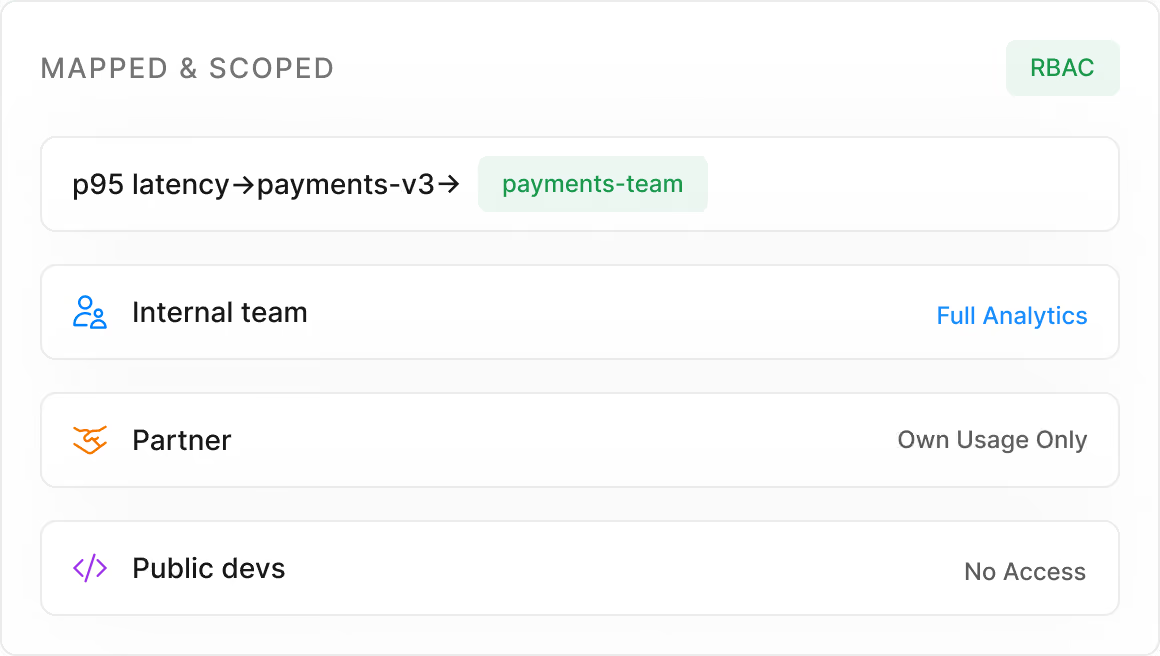
Tied to the catalog, with RBAC
Every metric maps to a known API and owner, and role-based access lets teams and partners self-serve only the analytics they should see.
How we compare
How does DigitalAPI compare to other API analytics approaches?
API analytics tools fall into three camps: single-gateway analytics that only see their own gateway, product analytics tools that are strong on user behavior but wired API by API, and observability suites built for infrastructure. DigitalAPI is one estate-wide layer that joins operational and business analytics and maps every metric to the catalog.
Capability
%20(1).svg)
Single-gateway analytics
Product analytics
Observability suites
Estate-wide across gateways & clouds
Every gateway
One gateway
Per-API setup
Infra, not estate
Operational metrics (latency, errors, uptime)
Limited
Strong
Usage & adoption insight
Basic
Strong
Limited
Business & revenue insight
Strong
Consumer-level analytics
Per app
Strong
Limited
Anomaly detection & alerts
Basic
Strong
Tied to catalog & ownership
Self-serve for teams & partners
Built in
Portal
Limited
Estate-wide across gateways & clouds
Every gateway
Single-gateway analytics
One gateway
Product analytics
Per-API setup
Observability suites
Infra, not estate
Operational metrics (latency, errors, uptime)
Single-gateway analytics
Product analytics
Limited
Observability suites
Strong
Usage & adoption insight
Single-gateway analytics
Basic
Product analytics
Strong
Observability suites
Limited
Business & revenue insight
Single-gateway analytics
Product analytics
Strong
Observability suites
Consumer-level analytics
Single-gateway analytics
Per app
Product analytics
Strong
Observability suites
Limited
Anomaly detection & alerts
Single-gateway analytics
Basic
Product analytics
Observability suites
Strong
Tied to catalog & ownership
Single-gateway analytics
Product analytics
Observability suites
Self-serve for teams & partners
Built in
Single-gateway analytics
Portal
Product analytics
Limited
Observability suites
Outcomes
What results can you expect?
%20(1).avif)
%20(1).avif)
1 view
Every API, every gateway, instead of siloed dashboards.
60%
Faster issue detection with estate-wide anomaly alerts.
100%
Of API traffic visible across gateways and consumers.
0
Per-API instrumentation needed to start.
Frequently asked questions
API analytics FAQs
What metrics does API analytics track?
On the operational side: traffic volume, latency including p95 and p99, error rates, and uptime. On the business side: adoption, top consumers, usage by endpoint and app, and usage-driven value. DigitalAPI surfaces both, per API and per gateway.
What is the difference between operational and business API analytics?
Operational analytics is about performance and reliability (latency, errors, uptime) and serves engineering and operations. Business analytics is about adoption, consumers, and value, and serves product and business owners. Great API analytics, and DigitalAPI, joins both.
How does analytics connect to monetization and governance?
Usage data feeds directly into metering and billing for monetization, and into governance for anomaly and policy signals. Because analytics is tied to the same catalog, the numbers driving revenue and oversight come from one consistent source.
What is the difference between API analytics and API monitoring?
Monitoring answers whether an API is healthy right now, focusing on uptime, response time, and error alerts. Analytics answers what is happening and why over time: usage trends, adoption, consumers, and value. They overlap, and DigitalAPI covers both in one place.
How does it work across multiple gateways?
DigitalAPI streams traffic, logs, and usage from Apigee, Kong, AWS, and Azure, normalizes everything into one schema, and maps each metric to a known API, owner, and consumer, so you get one estate-wide view instead of separate per-gateway dashboards.
Can it detect anomalies and send alerts?
Yes. DigitalAPI flags error spikes, latency regressions, and unusual traffic automatically, and routes alerts to channels like Slack, PagerDuty, or email so teams can respond before consumers are affected.

.avif)