
What is API Observability? An Essential Guide for Beginners
Discover API observability: the key to detecting, troubleshooting, and fixing API issues before users notice. Learn why it’s essential for resilient systems
What happens when your APIs break and you don’t even know why?
While APIs are the backbone of countless applications and services, ensuring they perform reliably, securely, and without disruption can be a big challenge.
Unfortunately, traditional monitoring alone won’t save you. That’s where API observability steps in. Unlike traditional API monitoring, which tells you what happened, observability goes beyond tracking uptime and errors and gives you deep, real-time insights into how your APIs behave, why issues occur, and how to fix them before users notice.
It gives your teams the visibility they need to build resilient systems. This guide breaks down API observability for beginners, exploring its core pillars and components, why it matters, and how to put it into action. If you’re managing APIs, this is your blueprint for smarter, faster, and more confident decision-making.
What is API observability?
API observability is the practice of analysing logs, metrics, and traces to understand an API’s performance, health, and behaviour. It enables teams to detect issues, optimise performance and security, and improve reliability by providing real-time insights into how APIs function.
Unlike basic API monitoring, which tracks predefined outputs, observability reveals why problems occur by tracking key data like request rates, error patterns, latency, and security threats. Instead of just checking if an API is "up or down," observability uncovers why issues occur, helping teams troubleshoot faster and optimise performance.
Why is API observability crucial?
API observability is crucial because it provides deep visibility into the behaviour, performance, and reliability of APIs in real time. It enables teams to gain deep insights into API behaviour, allowing them to detect issues, optimise performance, enhance security, and improve overall API governance.
Without proper observability, companies risk encountering unexpected failures, security breaches, and poor user experiences.
Here’s why API observability is crucial:
1. Enables early detection of issues
One of the most significant benefits of API observability is its ability to catch problems early, before they spiral into full-blown outages. APIs often act as the communication bridge between critical systems, and even minor slowdowns can disrupt user workflows.
With API observability tools in place, teams can monitor response times, track request rates, and detect anomalies in real time.
This early detection allows developers to act quickly, resolve issues faster, and prevent potential downtime. In a world where every second counts, this level of insight keeps services running reliably and ensures users stay happy.
2. Improves performance
Fast, responsive APIs deliver exceptional user experiences. Observability plays a key role in performance tuning by shedding light on latency, throughput, and system bottlenecks.
If an API takes too long to respond, users may abandon the app or transaction, which can impact customer satisfaction and cost you revenue.
API observability provides detailed performance metrics so development teams can identify which endpoints are lagging and make the necessary improvements. This not only enhances speed but also boosts the efficiency of backend systems.
3. Enhances security and compliance
APIs are frequent targets for cyberattacks because they often expose sensitive data and access points. API Observability equips security teams with the tools to monitor for unusual behaviour, such as unauthorised access attempts, data breaches, high failure rates in authentication, or unexpected traffic spikes.
These indicators can reveal potential breaches or vulnerabilities that need immediate attention. Additionally, many industries require strict compliance with regulations like GDPR or HIPAA.
Observability ensures that every interaction is logged and traceable, making it easier to demonstrate compliance and maintain trust with regulators and customers alike.
4. Enables faster debugging and troubleshooting
Without visibility into what an API is doing, troubleshooting can feel like guesswork. When things go wrong, whether it’s a misconfiguration, a broken integration, or faulty code, API observability tools give developers the context they need to fix issues quickly.
Besides, API Logs, traces, and metrics reveal where and why failures happen, helping teams zero in on root causes. This not only shortens resolution times but also reduces the risk of repeat errors.
5. Improves API governance
Beyond technical benefits, API observability supports strategic goals by offering insights into how APIs are used and managed. It enables teams to track usage patterns so they can enforce governance policies, allocate resources more effectively, and ensure consistency across services.
This level of oversight helps in maintaining API quality, standardising development practices, and aligning APIs with business goals. Whether you're scaling your API ecosystem or monetising access, observability provides the data needed to make informed decisions and keep operations aligned with long-term objectives.
6. Helps in troubleshooting API errors and fixing issues quickly
APIs can fail for many reasons, such as broken dependencies, unexpected inputs, or external service disruptions. API observability simplifies troubleshooting by providing a bird’s-eye view of all API activity.
It provides developers with clear visibility into error logs and dependency chains, which allows them to identify exactly where failures occur. This allows for rapid diagnosis and resolution, minimising disruption to end users and maintaining service continuity.
7. Detection and protection from API threats
As API attacks become more complex, security teams need more than just perimeter defences; they need insight. API observability helps detect and analyse security threats, such as token abuse, injection attacks, or brute-force attempts.
It helps organisations to monitor traffic flows and request behaviour, which helps to uncover vulnerabilities and take preventive action. This level of proactive defence is essential for protecting sensitive data and ensuring the integrity of digital systems.
8. Understand customer API usage
Knowing how customers use your APIs can uncover opportunities for improvement. Using an API observability tool like DigitalAPICraft can help you collect usage data like which endpoints are called most often, what data is being requested, and how users interact with services.
Product teams can then use these insights to refine APIs, improve documentation, and prioritise new features. This enables organisations to align API development with actual user needs and deliver more value while staying ahead of evolving expectations.
What is the Difference Between API Observability and API Monitoring?
At its core, API monitoring tracks predefined metrics to detect known issues, while API observability offers a broader, real-time understanding of system behaviour by analysing logs, traces, and metrics together. In a nutshell, monitoring answers “what happened,” whereas observability helps uncover “why it happened” before users feel the impact. Here is a summary of the key differences between API monitoring and observability:
The key pillars of API observability
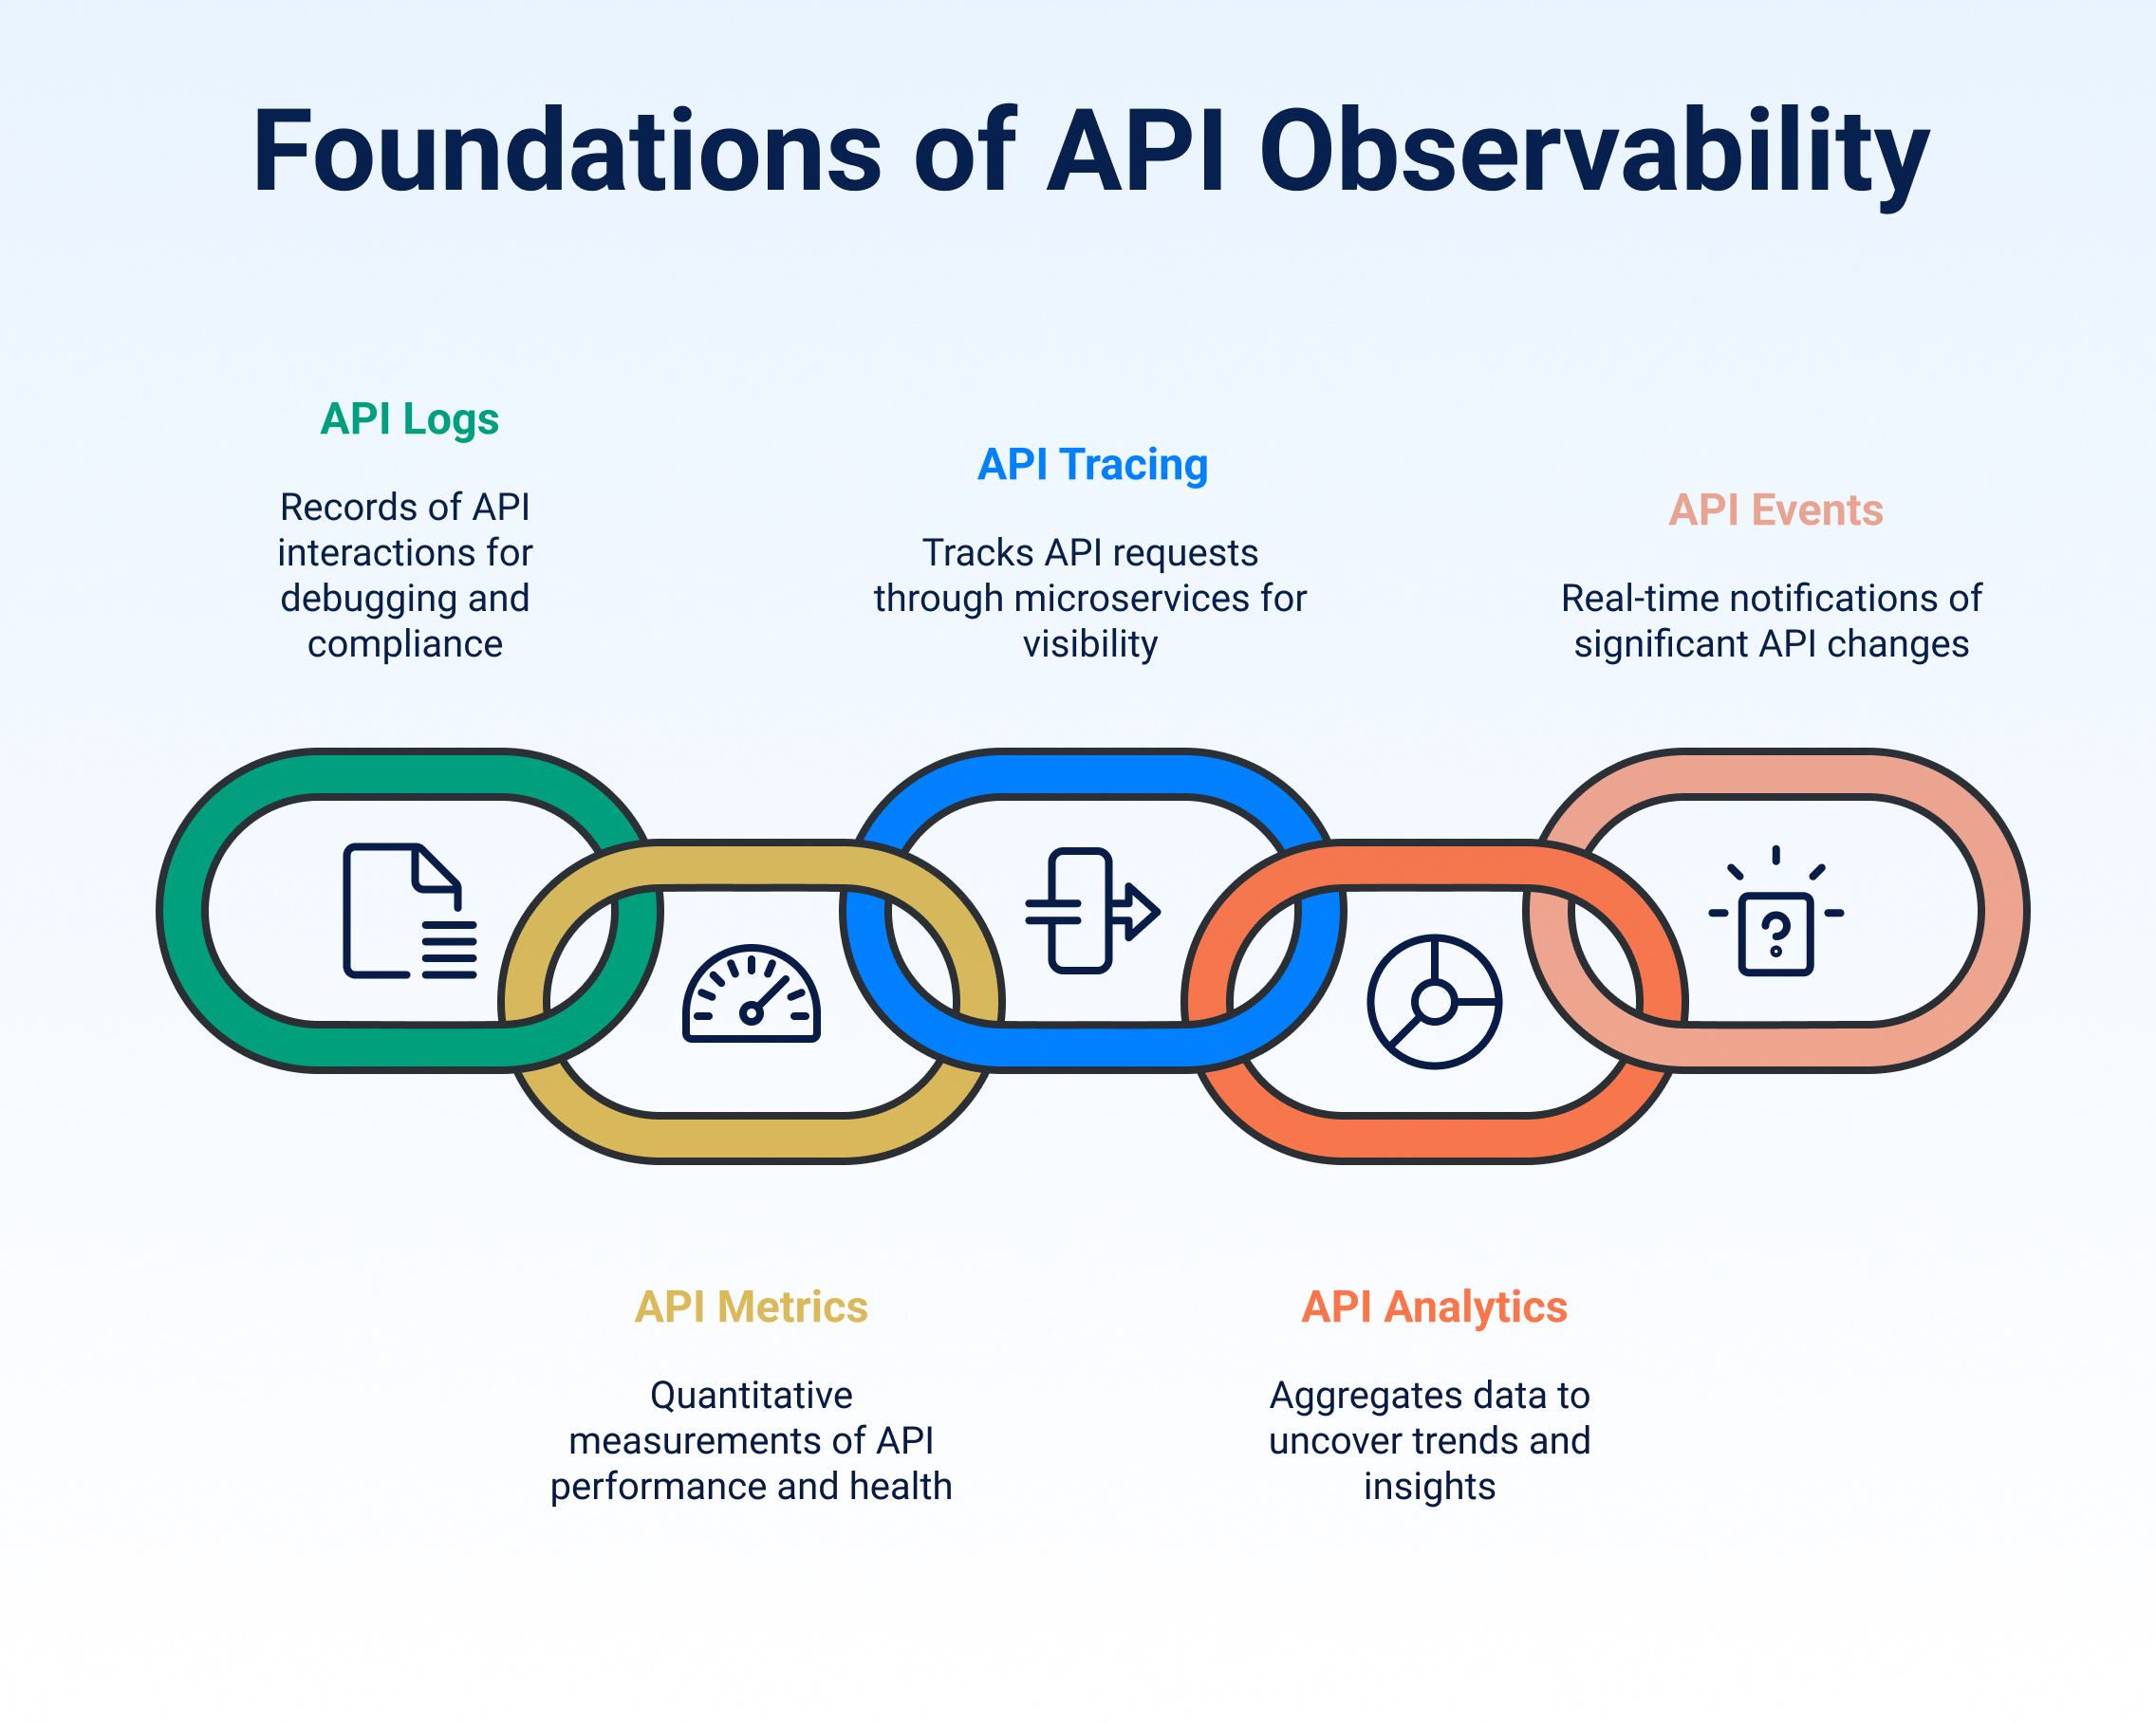
The key pillars of API Observability include API logs that help track requests and responses, API metrics that highlight system performance, API tracing that reveals request journeys, API analytics that uncover usage trends, and API events that capture real-time changes. Together, these pillars offer deep visibility into API behaviour and performance.
Here is a detailed look at each pillar:
1. API logs
API logs are records of every API interaction, including incoming requests, outgoing responses, headers, payloads, status codes, and timestamps. These logs provide a detailed, sequential history of API activity.
They act as a detailed audit trail, documenting who accessed the API, what was requested, and how the system responded.
API logs matter for a couple of reasons, including:
- Debugging and troubleshooting: Logs help developers pinpoint failures by showing exactly where and why an error occurred.
- Security and compliance: They provide evidence of unauthorised access or misuse, aiding in compliance with regulations like GDPR.
- They provide performance insights: By analysing logs, teams can detect latency issues or abnormal patterns in API usage.
Ultimately, API logs offer raw visibility. Without them, debugging becomes guesswork. Effective logging ensures that no incident goes unnoticed and supports root cause analysis, compliance, and historical investigation.
2. API metrics
API metrics are quantitative measurements that track the performance and health of APIs. Common metrics include response times, error rates, throughput (requests per second), and uptime.
API metrics are crucial for the following reasons:
- Performance monitoring: Metrics like latency and error rates reveal how well an API performs under load.
- Capacity planning: Tracking throughput helps teams scale infrastructure proactively.
- SLA adherence: Metrics ensure APIs meet service-level agreements by highlighting deviations from expected behaviour.
3. API tracing
API tracing follows an API request as it travels through various microservices or components. It provides a holistic view of how data flows through distributed architectures. Each segment of the journey is recorded as a “span,” which collectively forms a trace.
API tracing is essential for the following reasons:
- End-to-end visibility: Tracing identifies bottlenecks in complex workflows, such as slow database queries or third-party service delays.
- Root cause analysis: When a request fails, tracing shows which component failed, reducing mean time to resolution (MTTR).
- Optimisation: Teams can refine performance by analysing trace data to eliminate inefficiencies.
Overall, API tracing brings clarity to complexity. It allows teams to visualise dependencies and isolate performance issues that aren’t visible through logs or metrics alone. It’s especially helpful during outages or high-latency scenarios, as it reveals precisely where the problem originates.
4. API Analytics
API analytics involves aggregating and interpreting data from logs, metrics, and traces to uncover trends, usage patterns, and business insights.
Analytics focus on behavioural insights like which endpoints are most active, which users generate the most traffic, or what regions experience the highest error rates.
While logs and metrics show what’s happening technically, analytics reveal why it’s happening. For instance, a spike in traffic might seem problematic until analytics show it's due to a new customer integration. Analytics uncover trends, enable data-driven decisions, and support product strategy.
By providing insights beyond infrastructure, analytics bridges the gap between API performance and business outcomes. They help teams prioritise improvements, reduce churn, and better understand user behaviour.
When paired with other observability tools, analytics provide context that enhances troubleshooting and system design.
5. API events
API events are real-time, structured notifications triggered by significant changes or actions in the API ecosystem. These might include schema changes, deployment updates, traffic surges, or threshold breaches.
API events are useful in the following ways:
- They provide immediate alerts: Events notify teams of critical issues the moment they happen, enabling rapid response.
- They enable automated actions: Integrations with incident management tools can auto-remediate problems (e.g., scaling resources during traffic surges).
- They provide audit trails: Event logs provide a timeline of incidents for post-mortem analysis.
API observability relies on these five pillars to deliver complete, end-to-end visibility into API ecosystems.
Key components of API observability
API observability hinges on five essential components, which are logging, visualisation, monitoring, alerting, and analysis. These elements work together to help teams understand how APIs behave in real-time, identify issues early, and maintain consistent performance across environments.
Let’s explore these components further.
1. Logging
Logging is the foundation of API observability. It involves capturing detailed records of everything the API does, from incoming requests and response statuses to errors and execution paths.
These logs act like a digital trail, showing developers exactly what happened and when it occurred. For instance, if a request returns a 500 error, logs can pinpoint the failing component and the sequence of events leading up to it.
Effective logging ensures transparency. Structured logs, formatted in JSON or similar schemas, make it easier to parse, search, and analyse data.
2. Visualisation
Visualisation turns raw logs and metrics into understandable visuals. Instead of sifting through endless lines of data, teams can interact with dashboards showing response times, error rates, and traffic volumes in charts, graphs, and tables.
This visual representation makes it easier to spot abnormal trends and performance bottlenecks at a glance.
3. Monitoring
Monitoring involves the continuous tracking of API metrics to assess health and performance. It includes tracking key indicators like latency, uptime, error rates, and throughput. Monitoring tools collect this data and compare it against set thresholds or historical baselines to detect irregular behaviour.
This proactive oversight helps teams intervene before users experience downtime or degraded service. For example, if an API that usually responds in under 100 milliseconds suddenly starts taking 300 milliseconds, a monitoring system will flag it.
DigitalAPICraft supports integration with top monitoring tools, offering consistent insights across API deployments.
4. Alerting
What happens when your API performance goes down? This is where API alerting becomes useful. Your API tool notifies you in real time.
These notifications can be based on threshold breaches (like response times exceeding a set value) or more sophisticated anomaly detection using machine learning to identify outliers in usage or performance patterns.
An effective alerting system avoids false positives while ensuring genuine issues don’t go unnoticed.
Platforms like DigitalAPICraft help streamline alert configurations by offering pre-set rules and easy integration with alerting tools.
5. Analysis
Analysis ties everything together by interpreting the collected data to uncover trends, detect anomalies, and guide improvements. This step involves both real-time analytics, which is useful for incident response, and historical analysis for understanding long-term usage patterns and performance drift.
Analytical tools can correlate logs, metrics, and traces to deliver a full picture of how APIs are being used and where they can be optimised. For example, consistent spikes in latency from a specific region may indicate a need for better edge infrastructure.
With integrated analytics, DigitalAPICraft empowers teams to make informed decisions about scaling, error handling, and performance tuning.
Together, logging, visualisation, monitoring, alerting, and analysis form the backbone of a solid API observability strategy.
They not only help detect issues early but also provide clarity on root causes and long-term trends. Platforms like DigitalAPI bring these components into a unified ecosystem, helping teams deliver high-performing, resilient APIs with confidence.
How to implement API observability step by step
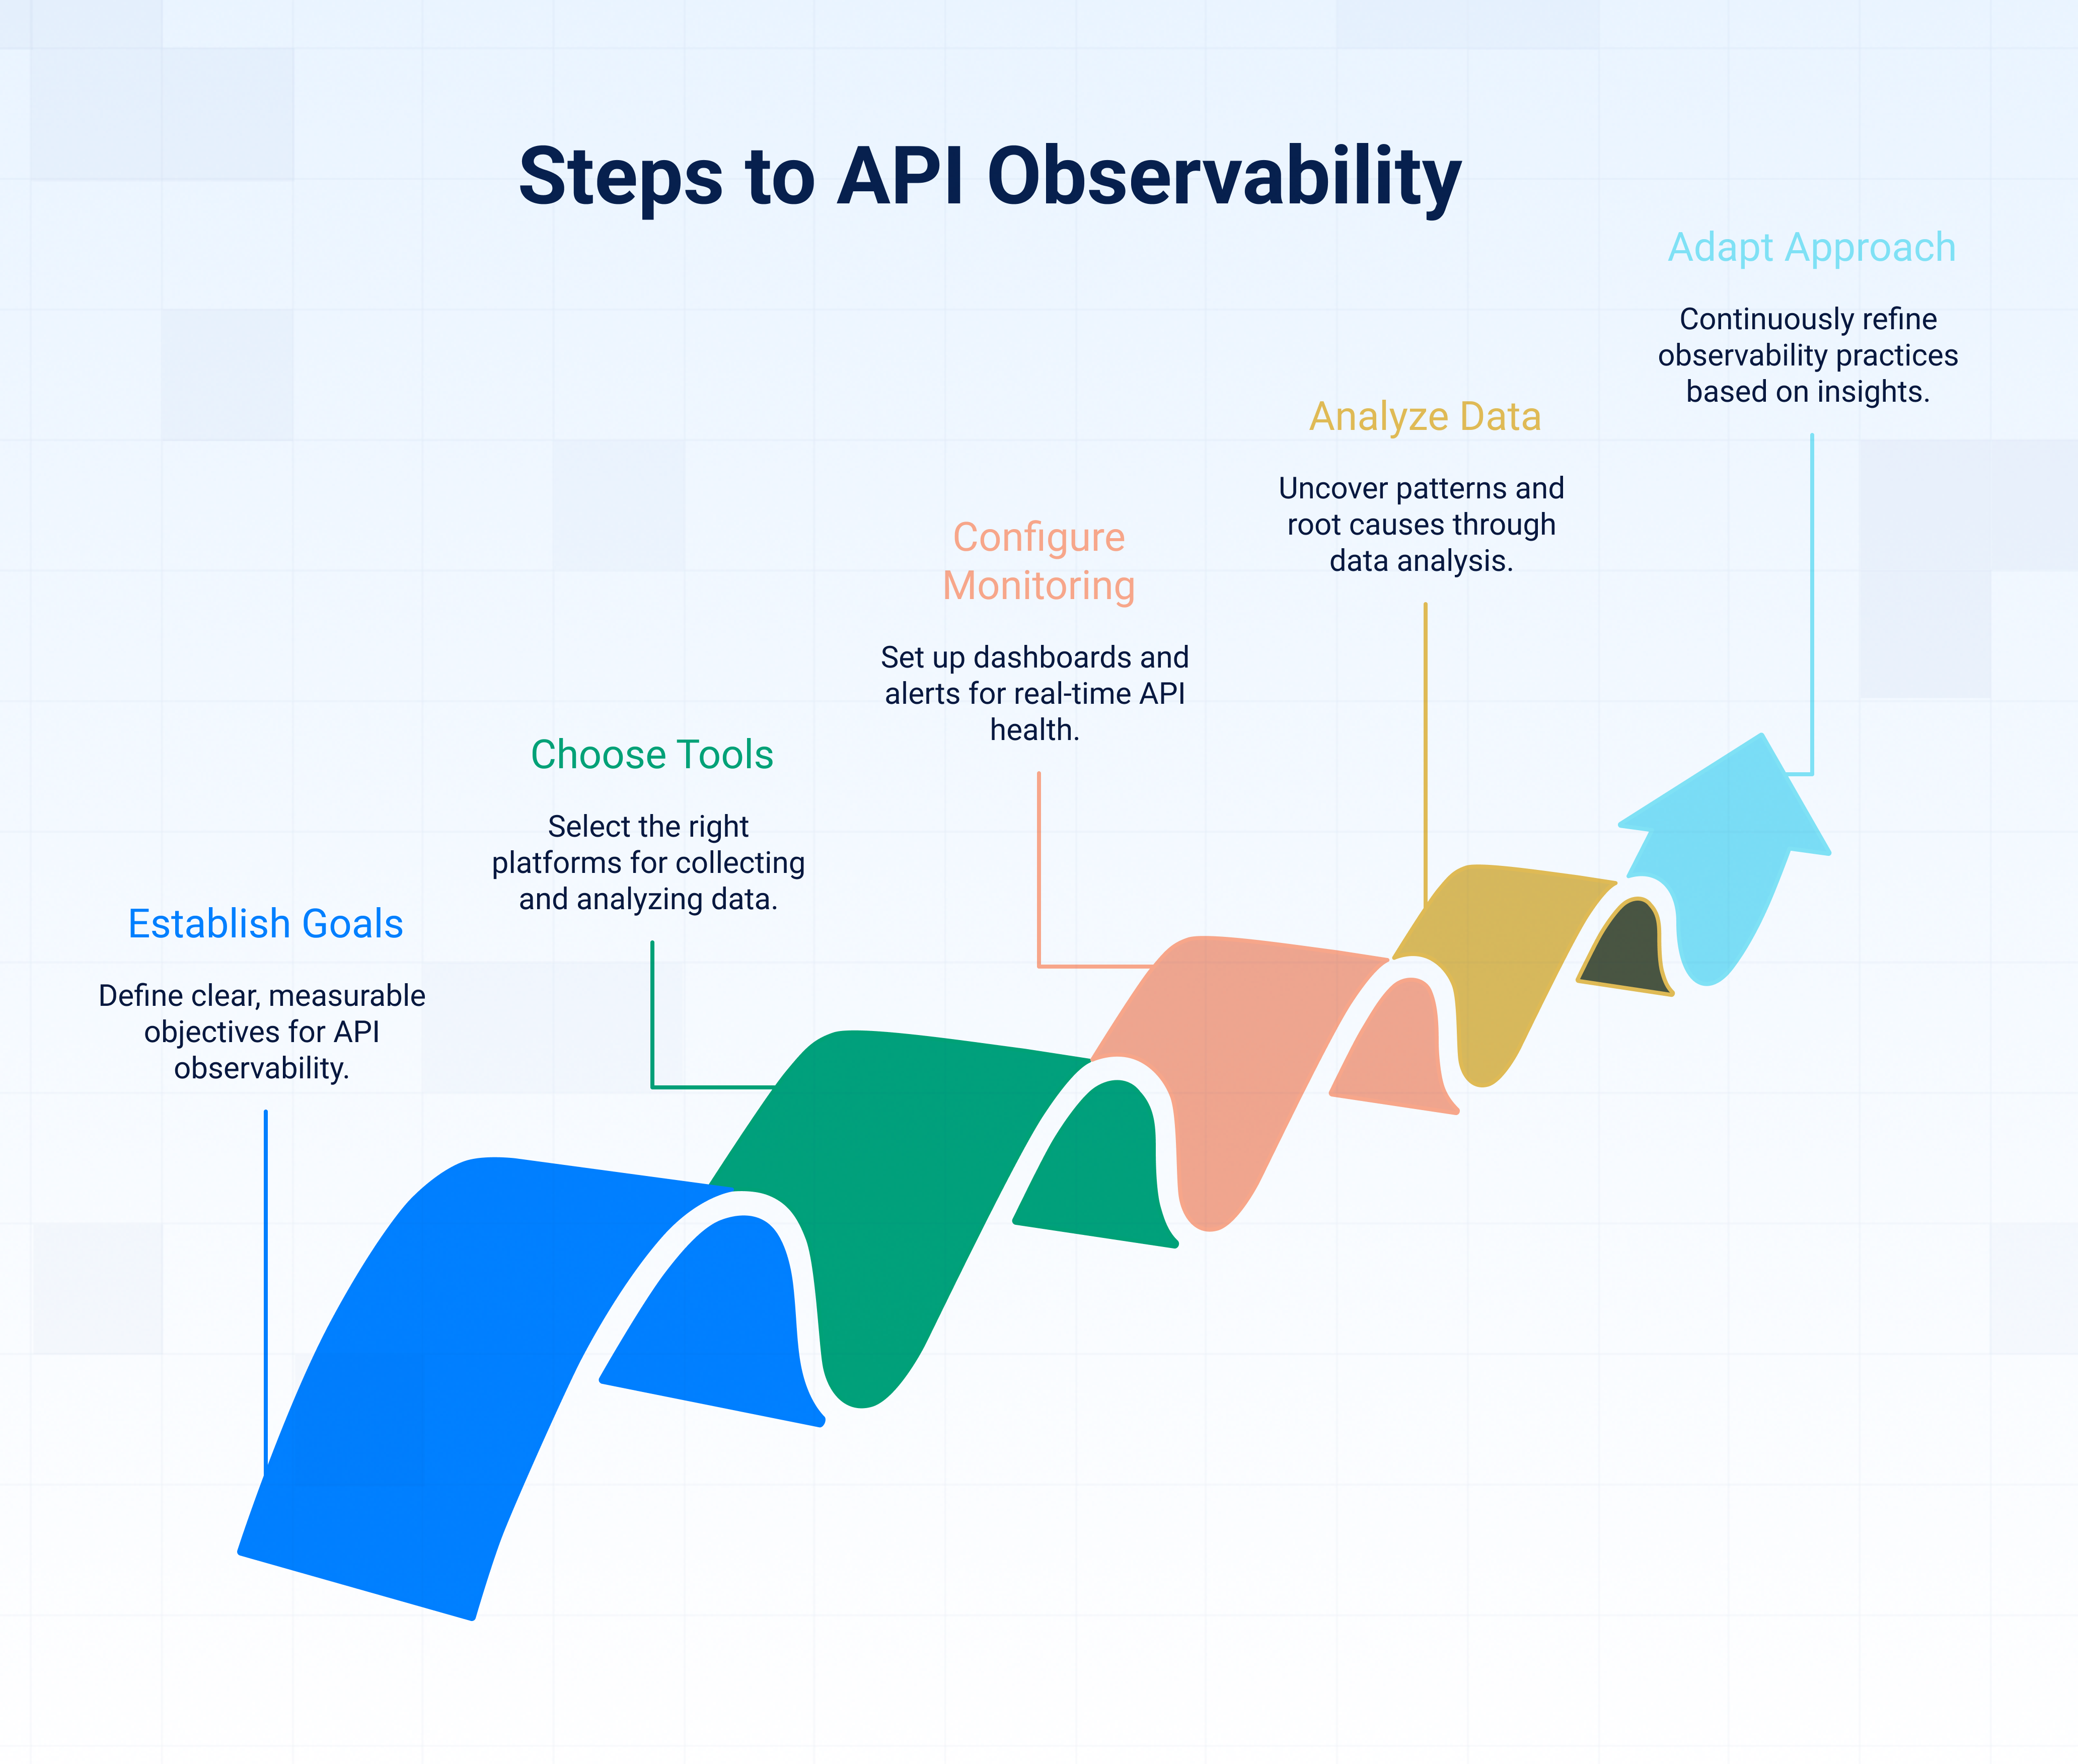
To implement API observability effectively, start by defining your goals, pick the right tools, set up tailored monitoring and alerting, analyse the data for insights, and continuously refine your approach. Each step helps build a clear picture of API health, performance, and reliability.
1. Establish clear goals for your API observability strategy
The first step in building a strong API observability practice is knowing exactly what you want to achieve. Whether your focus is reducing service disruptions, improving response times, or identifying performance bottlenecks, having clear, measurable goals helps you stay aligned throughout the process. This clarity also makes it easier to prioritise which data you need to collect and how to interpret it.
Choose the right API tools
Once you have clear goals, the next move is selecting the right tools. You'll need platforms that can collect and make sense of logs, traces, and metrics. When choosing API tools, consider ease of integration with your current systems, scalability, and cost-effectiveness.
2. Configure monitoring and alerting mechanisms
With tools ready, it's time to configure monitoring dashboards and alerts. Set up rules that trigger alerts when specific thresholds are crossed, such as high latency, increased error rates, or resource spikes.
Make sure these alerts reach the right teams and come with enough context to enable fast troubleshooting. Poorly configured alerts can lead to fatigue, so it's important to balance sensitivity and relevance.
3. Dig into the data for insights
Simply collecting observability data isn’t enough. You need to analyse that information to uncover patterns and root causes actively. Use your analytics tools to drill into logs and traces to see how different parts of your API interact. This step can reveal underlying issues like inefficient code paths or dependencies that slow down the system under load.
4. Adapt based on what you learn
Observability isn't a one-time setup. Regularly revisit your dashboards, alerts, and tools to make sure they’re still aligned with your goals. Listen to feedback from developers and operations teams to improve how information is presented and acted on. As your API evolves, your observability approach should evolve with it.
Follow these steps to build an observability practice that gives your teams the insights they need to keep APIs running smoothly and efficiently.
Best practices for API observability
To build reliable and high-performing APIs, API observability must be treated as a proactive, ongoing discipline, rooted in continuous improvement, automation, and team collaboration. Strong observability helps teams detect, understand, and resolve issues quickly by providing deep insights into API behaviour, performance, and failures.
Here are six best practices to strengthen API observability and ensure your systems remain resilient and scalable.
1. Make API observability a continuous process
API observability isn't a one-time setup. It should evolve alongside your API architecture, user needs, and business goals. Treat it as a living system that requires regular tuning.
Begin by conducting routine audits of your observability stack. This includes reviewing your logging, metrics, and tracing configurations. Are you capturing the right data? Are alerts too noisy or not triggering early enough? Adjusting your approach based on these reviews helps eliminate blind spots.
Equally important is establishing feedback loops across teams. Developers, SREs, and support staff who work closest with incidents often have valuable insights on what’s missing or not working. Use their input to refine dashboards, metrics, or thresholds.
Finally, stay updated with new tools and approaches. Observability platforms and techniques are evolving rapidly, and adopting innovations like eBPF-based tracing or AI-powered anomaly detection can provide more actionable insights with less overhead.
2. Automate API observability
Manual observability doesn't scale. Automating key processes increases reliability, reduces human error, and ensures consistency across environments.
Start with data collection. Use agents, SDKs, or sidecars to automatically capture logs, metrics, and traces. Modern observability tools integrate directly into your infrastructure and applications, making it easier to gather telemetry data without extra code.
Automated alerting is another must-have. Define thresholds for latency, error rates, and traffic anomalies, and configure alerts that route to the right teams via chat, ticketing, or incident response tools. This ensures issues are flagged immediately, even outside of business hours.
You can take automation further by wiring it into your incident response workflows. For example, when an alert pops, trigger a remediation script or auto-create a ticket with logs and traces attached. This speeds up recovery and reduces the need for manual triage.
3. Make API observability a collaborative effort
Effective observability is not just a DevOps concern but a cross-functional responsibility. When teams work together, they gain a broader perspective and resolve issues faster.
A great place to start is by building shared dashboards. Instead of siloed views, create unified dashboards that display performance metrics, error rates, and usage patterns across environments. Everyone from backend engineers to support reps should be able to access and interpret these insights.
Hold regular sync-ups to review observability trends, recent incidents, and opportunities for improvement. These meetings foster alignment and help reinforce shared ownership of reliability.
Encourage knowledge sharing, too. If someone finds a better way to visualise API latency or reduce log noise, document it and share it broadly. This creates a culture where observability becomes a team skill, not just a specialised task.
4. Focus on end-to-end visibility
Observability should span your entire system, not just isolated APIs. Gaps between services can make it harder to trace issues or understand root causes.
Use distributed tracing to connect the dots between services. When a request spans multiple APIs or components, traces help visualise the full path, including where delays or failures occur. This is especially critical in microservices or serverless environments.
Additionally, ensure logs and metrics from each service are correlated with shared identifiers (like trace IDs). This correlation enables engineers to quickly move from a spike in errors to the exact log lines that explain why.
End-to-end visibility also means covering infrastructure and third-party dependencies. Monitor API gateways, load balancers, and external APIs that could impact your system’s performance or availability.
5. Standardise telemetry data
Consistency is key to extracting value from observability data. Without standard naming conventions or formats, teams may struggle to interpret metrics or automate alerting.
Establish common schemas for logs, metrics, and traces. For instance, all APIs could report response times using the same metric name and tags (e.g., api.response_time with endpoint and status_code tags). This makes it easier to build dashboards and write queries that apply across services.
Use structured logging with JSON output so that logs can be parsed and filtered easily. Include contextual fields like request ID, user ID, or environment to enrich logs with meaningful metadata.
Adopting open standards like OpenTelemetry can also help. It provides vendor-neutral APIs and SDKs for collecting telemetry data in a consistent, scalable way.
6. Prioritise actionable insights
Collecting data isn’t enough; your observability system must provide insights that are easy to act on.
Avoid overwhelming teams with too many metrics or unfiltered logs. Instead, identify high-signal indicators of system health, such as error rate, request latency, and saturation, and focus on visualising and alerting around those.
Make dashboards simple and intuitive. Highlight anomalies, trends, and correlations that lead to faster root cause analysis.
Use visual elements like heatmaps, histograms, and service maps to surface issues more effectively than text-based logs alone.
Finally, tie observability data to business impact. Monitor not just technical metrics, but also customer experience indicators like failed logins or checkout errors to prioritise the incidents that matter most.
Strategies to improve API observability
To improve API observability, focus on three essential strategies: implement distributed tracing, set up real-time monitoring with alerting, and correlate logs, metrics, and traces. Together, these approaches provide a complete view of how your APIs behave, helping teams spot issues early, trace performance bottlenecks, and maintain system reliability.
Start with distributed tracing
Distributed tracing offers visibility into how requests move through your system, especially important in a microservices setup.
Since API requests often pass through multiple services, tracing helps map each step in the journey. This makes it easier to pinpoint where delays or failures occur.
You can quickly isolate the root cause of a slowdown, whether it’s a database call, a third-party service, or a slow microservice.
Distributed tracing also shows service dependencies clearly, so you can see how changes in one component affect others. That insight is critical for both debugging and performance tuning.
Enable real-time monitoring and alerting
Once your system is up and running, you need to know when things go wrong before users do. Real-time monitoring keeps a constant eye on API activity, allowing teams to detect unusual behaviour as it happens.
This includes tracking response times, error rates, and throughput. Set alerts to trigger when something deviates from the norm. But don’t rely on fixed thresholds; use dynamic baselines that adapt over time to avoid alert fatigue.
The more granular the metrics, the faster you can act on problems. Monitoring isn’t just about catching failures; it’s also about maintaining a consistent user experience.
Correlate API logs, metrics, and traces for deeper insights
Each observability signal, log, metric, and trace tells part of the story. But when you correlate them, the full picture comes into focus. Suppose your metrics show a sudden spike in latency.
Alone, that’s just a red flag. But paired with error logs and a trace that shows which service caused the delay, you can zero in on the issue fast.
This layered view speeds up diagnosis and reduces the time spent jumping between tools. Integrated observability also helps you understand how performance issues evolve and affect other parts of the system.
If you combine these three strategies, you can move from reactive firefighting to proactive API management. Distributed tracing shows what happened, monitoring tells you when it happened, and correlation reveals why it happened. Together, they provide the clarity and control needed to support high-performing, reliable APIs.
Critical metrics to measure API observability
To measure API observability effectively, focus on API usage metrics and API performance metrics. These metrics provide clear insights into how your APIs are being used and how well they’re performing, which helps you detect issues early and maintain a great developer experience.
Here is an in-depth look at the API observability metrics to track:
API usage metrics
Usage metrics help you understand who’s using your API, how often, and for what. These indicators give visibility into trends, anomalies, and adoption rates. They include:
- Request volume: Tracks the number of incoming API requests over time. Spikes or drops may signal new releases, client issues, or abuse.
- API endpoint usage: Highlights which endpoints are used most (or least). This can help prioritise maintenance and feature updates.
- User or app activity: Breaks down usage by consumer (like API keys or tokens), helping you understand engagement across different users.
- Rate limit status: Measures how often clients hit rate limits, revealing whether limits are too strict or if traffic is unusually high.
- Error rate by consumer: Helps identify which clients consistently send bad requests or experience issues, enabling faster support or outreach.
API performance metrics
Performance metrics reveal how fast and reliably your API behaves. They’re crucial for troubleshooting and ensuring consistent quality. API performance metrics include:
- Latency (response time): Measures the time it takes for the API to respond. Track this at both the global and endpoint levels to catch slowdowns.
- Error rate: Shows the percentage of requests that result in client-side (4xx) or server-side (5xx) errors. High error rates can signal outages or bad deployments.
- Availability/uptime: Monitors whether the API is reachable. Even small dips in uptime can impact SLAs and user trust.
- Request and response size: Tracks payload sizes, which can affect performance and mobile app data usage.
- Throughput (requests per second): Indicates how much load your API can handle, helping assess capacity and scalability.
Together, these metrics paint a full picture of how your API is used and how it performs, which is essential for keeping systems healthy and users happy.
Enhance your API observability with Digital API
With thousands, if not millions, of APIs out there, having clear visibility into your APIs is non-negotiable. But that can only be achieved with the right API tool. Digital API simplifies API observability by offering real-time monitoring, actionable insights, and seamless integration, all powered by AI.
With features like automated anomaly detection, detailed performance analytics, and intuitive dashboards, you can quickly identify and resolve issues before they impact users. What sets Digital API apart is its ability to adapt across industries, ensuring robust API management without complexity. Whether you're tracking latency, debugging errors, or optimising performance, the platform provides the tools you need to maintain reliable, high-performing APIs.
Want to take control of your API ecosystem? Explore how DigitalAPI can transform your observability strategy
FAQs
1. What are observability measures for an API?
Observability measures for an API include metrics, events, logs, and traces, often called the four pillars. Together, they provide visibility into system behaviour, performance, and failures. These measures help developers monitor API health, detect anomalies, trace requests, and quickly debug issues to ensure consistent, reliable performance.
2. How do you measure the performance of an API?
API performance is measured using metrics like response time, error rates, request throughput, and latency. Tools such as APMs, distributed tracing, and logging platforms help track these indicators in real-time, offering insights into bottlenecks, slow endpoints, and error sources across microservices or serverless architectures.
3. What are the key API observability metrics?
Key API observability metrics include latency (response time), throughput (requests per second), error rate (4xx/5xx responses), availability (uptime), and saturation (resource usage). Monitoring these helps assess performance, detect failures early, and maintain a reliable and scalable API experience for users and systems.

One email a fortnight. Worth opening.
A short digest of what we're writing, what we're learning from customers, and the handful of links you'd actually want from us. No tracking pixels.
.avif)