
Top 10 API Observability Tools: A 2026 Comparison
API observability is the ability to understand the internal state of your APIs by examining the data they output, specifically logs, metrics, and traces.

TL;DR
1. API observability goes beyond simple monitoring, focusing on understanding the 'why' behind performance shifts through logs, metrics, and traces.
2. With complex distributed systems, robust API observability is critical for detecting issues, troubleshooting root causes, and ensuring reliable user experiences.
3. The right tools provide comprehensive insights into API health, performance bottlenecks, and potential security vulnerabilities across your entire ecosystem.
4. Key considerations for choosing a tool include its ability to integrate with your existing stack, scalability, ease of use, and support for distributed tracing.
Modern digital experiences hinge on a vast, interconnected web of APIs, making their reliable operation non-negotiable. Yet, the sheer complexity of distributed architectures often shrouds their true behavior in mystery. Simply knowing an API is "up" is no longer enough; organizations need deep, actionable insights into how these critical interfaces are performing, where bottlenecks arise, and why problems occur. This demands a proactive approach to observability, one that empowers teams to move beyond basic monitoring and truly understand the intricate dance of requests, responses, and underlying infrastructure.
In this guide, we'll delve into the landscape of API observability, exploring its critical importance in 2026 and beyond. We’ll then compare the top 10 tools that equip engineering teams with the visibility needed to diagnose issues swiftly, optimize performance, and ensure their API ecosystem remains robust and responsive. From comprehensive commercial platforms to powerful open-source solutions, understanding these tools is key to maintaining a healthy, high-performing API infrastructure.
What is API Observability?
API observability is the ability to understand the internal state of your APIs by examining the data they output, specifically logs, metrics, and traces. Unlike traditional monitoring, which often focuses on predefined thresholds and known failure points, observability aims to provide comprehensive insights into unknown unknowns. It helps you answer complex questions about why an API is behaving in a certain way, even for scenarios you haven't explicitly monitored or anticipated.
For APIs, this means collecting granular data points across the entire request lifecycle: from the moment a request hits your gateway, through its journey across various microservices and databases, to the final response. By correlating logs (event details), metrics (time-series data like latency and error rates), and traces (the end-to-end path of a single request), teams gain the context needed to quickly identify root causes, troubleshoot performance issues, and proactively prevent outages.
Top 10 API Observability Tools: A 2026 Comparison
Selecting the right set of tools for API observability is critical. The market offers a diverse range of solutions, each with its strengths. Here’s a comparison of the top 10 API observability tools for 2026:
1. DigitalAPI
DigitalAPI is an enterprise-grade API management platform and intelligence platform built for organisations running APIs across multiple gateways, teams, and environments. Instead of acting as another gateway, it sits above existing tools to unify discovery, governance, and usage intelligence.
The platform focuses on making APIs easy to find, safe to consume, and ready for AI agents. It helps teams move from “APIs exist” to “APIs are actually used,” without forcing a rip-and-replace of their existing stack.
Key Features:
- Unified API Catalog: Aggregates APIs from gateways, repos, and tools into a single searchable catalog.
- Discovery for Devs & AI Agents: Enables humans and agents to find the right APIs with context and permissions.
- Centralised Governance: Apply consistent access, policy, and compliance rules across all APIs.
- Usage Analytics: Track who is using which APIs, how often, and with what impact.
- Self-Serve Portals & Sandboxes: Let teams onboard and test APIs without manual approvals.
Pros:
- Works across multiple gateways (Apigee, AWS, MuleSoft, Kong, etc.)
- Strong focus on adoption, reuse, and API consumption
- Built with AI-agent and MCP-readiness in mind
- Separates control plane from runtime gateways
Cons:
- Not designed for low-level infrastructure metrics
- Overkill for teams with only a handful of APIs
Ideal for:
Enterprises dealing with API sprawl, poor discoverability, and preparing APIs for AI-agent consumption.
2. Datadog
Datadog is a cloud-based observability platform built for monitoring modern, distributed systems. It brings together metrics, logs, traces, and user experience data into one unified interface, making it easier to understand how applications behave in production.
Teams typically use Datadog as their primary production monitoring tool. When an API slows down or errors spike, engineers can move from high-level dashboards to traces and logs quickly, without switching between multiple systems.
From an API observability standpoint, Datadog is strongest at runtime visibility. It shows how APIs perform under real traffic and how issues cascade across services, but it does not focus on API discovery, ownership, or governance.
Key Features:
- APM: Trace API requests through services to identify latency and failures.
- Infrastructure Monitoring: Monitor hosts, containers, and cloud resources supporting APIs.
- Log Management: Centralise and search API and service logs at scale.
- Distributed Tracing: Visualise API request paths across microservices.
- Synthetic Monitoring: Proactively test API endpoints before users are impacted.
Pros:
- Strong correlation between metrics, logs, and traces
- Excellent support for microservices and cloud-native stacks
- Rich dashboards and visualisations
Cons:
- Costs can grow quickly at scale
- Requires tuning to reduce noise in large environments
Ideal for:
Teams running large, distributed systems that need deep visibility into API performance and dependencies.
3. New Relic
New Relic is a full-stack observability platform with a strong emphasis on application performance monitoring. It helps teams understand how applications and APIs behave from user interaction down to code execution.
Teams often use New Relic to get quick clarity when something breaks. Its UI and service maps make it easier to trace API issues without stitching together multiple tools. From an API standpoint, New Relic provides strong transaction-level visibility, but, like Datadog, focuses more on runtime performance than discovery or governance.
Key Features:
- APM: Provides transaction-level visibility into API calls and code paths.
- Distributed Tracing: Tracks API requests across services and dependencies.
- Log Management: Correlates logs with traces for faster troubleshooting.
- Synthetic Monitoring: Tests API availability and response times proactively.
- AI Insights: Highlights anomalies and performance regressions automatically.
Pros:
- Strong code-level visibility for API transactions
- Intuitive UI for tracing and service mapping
- Good balance of depth and ease of use
Cons:
- Advanced features require paid tiers
- Less flexible for highly custom observability setups
Ideal for:
Teams that want detailed insight into API performance within application code paths.
4. Dynatrace
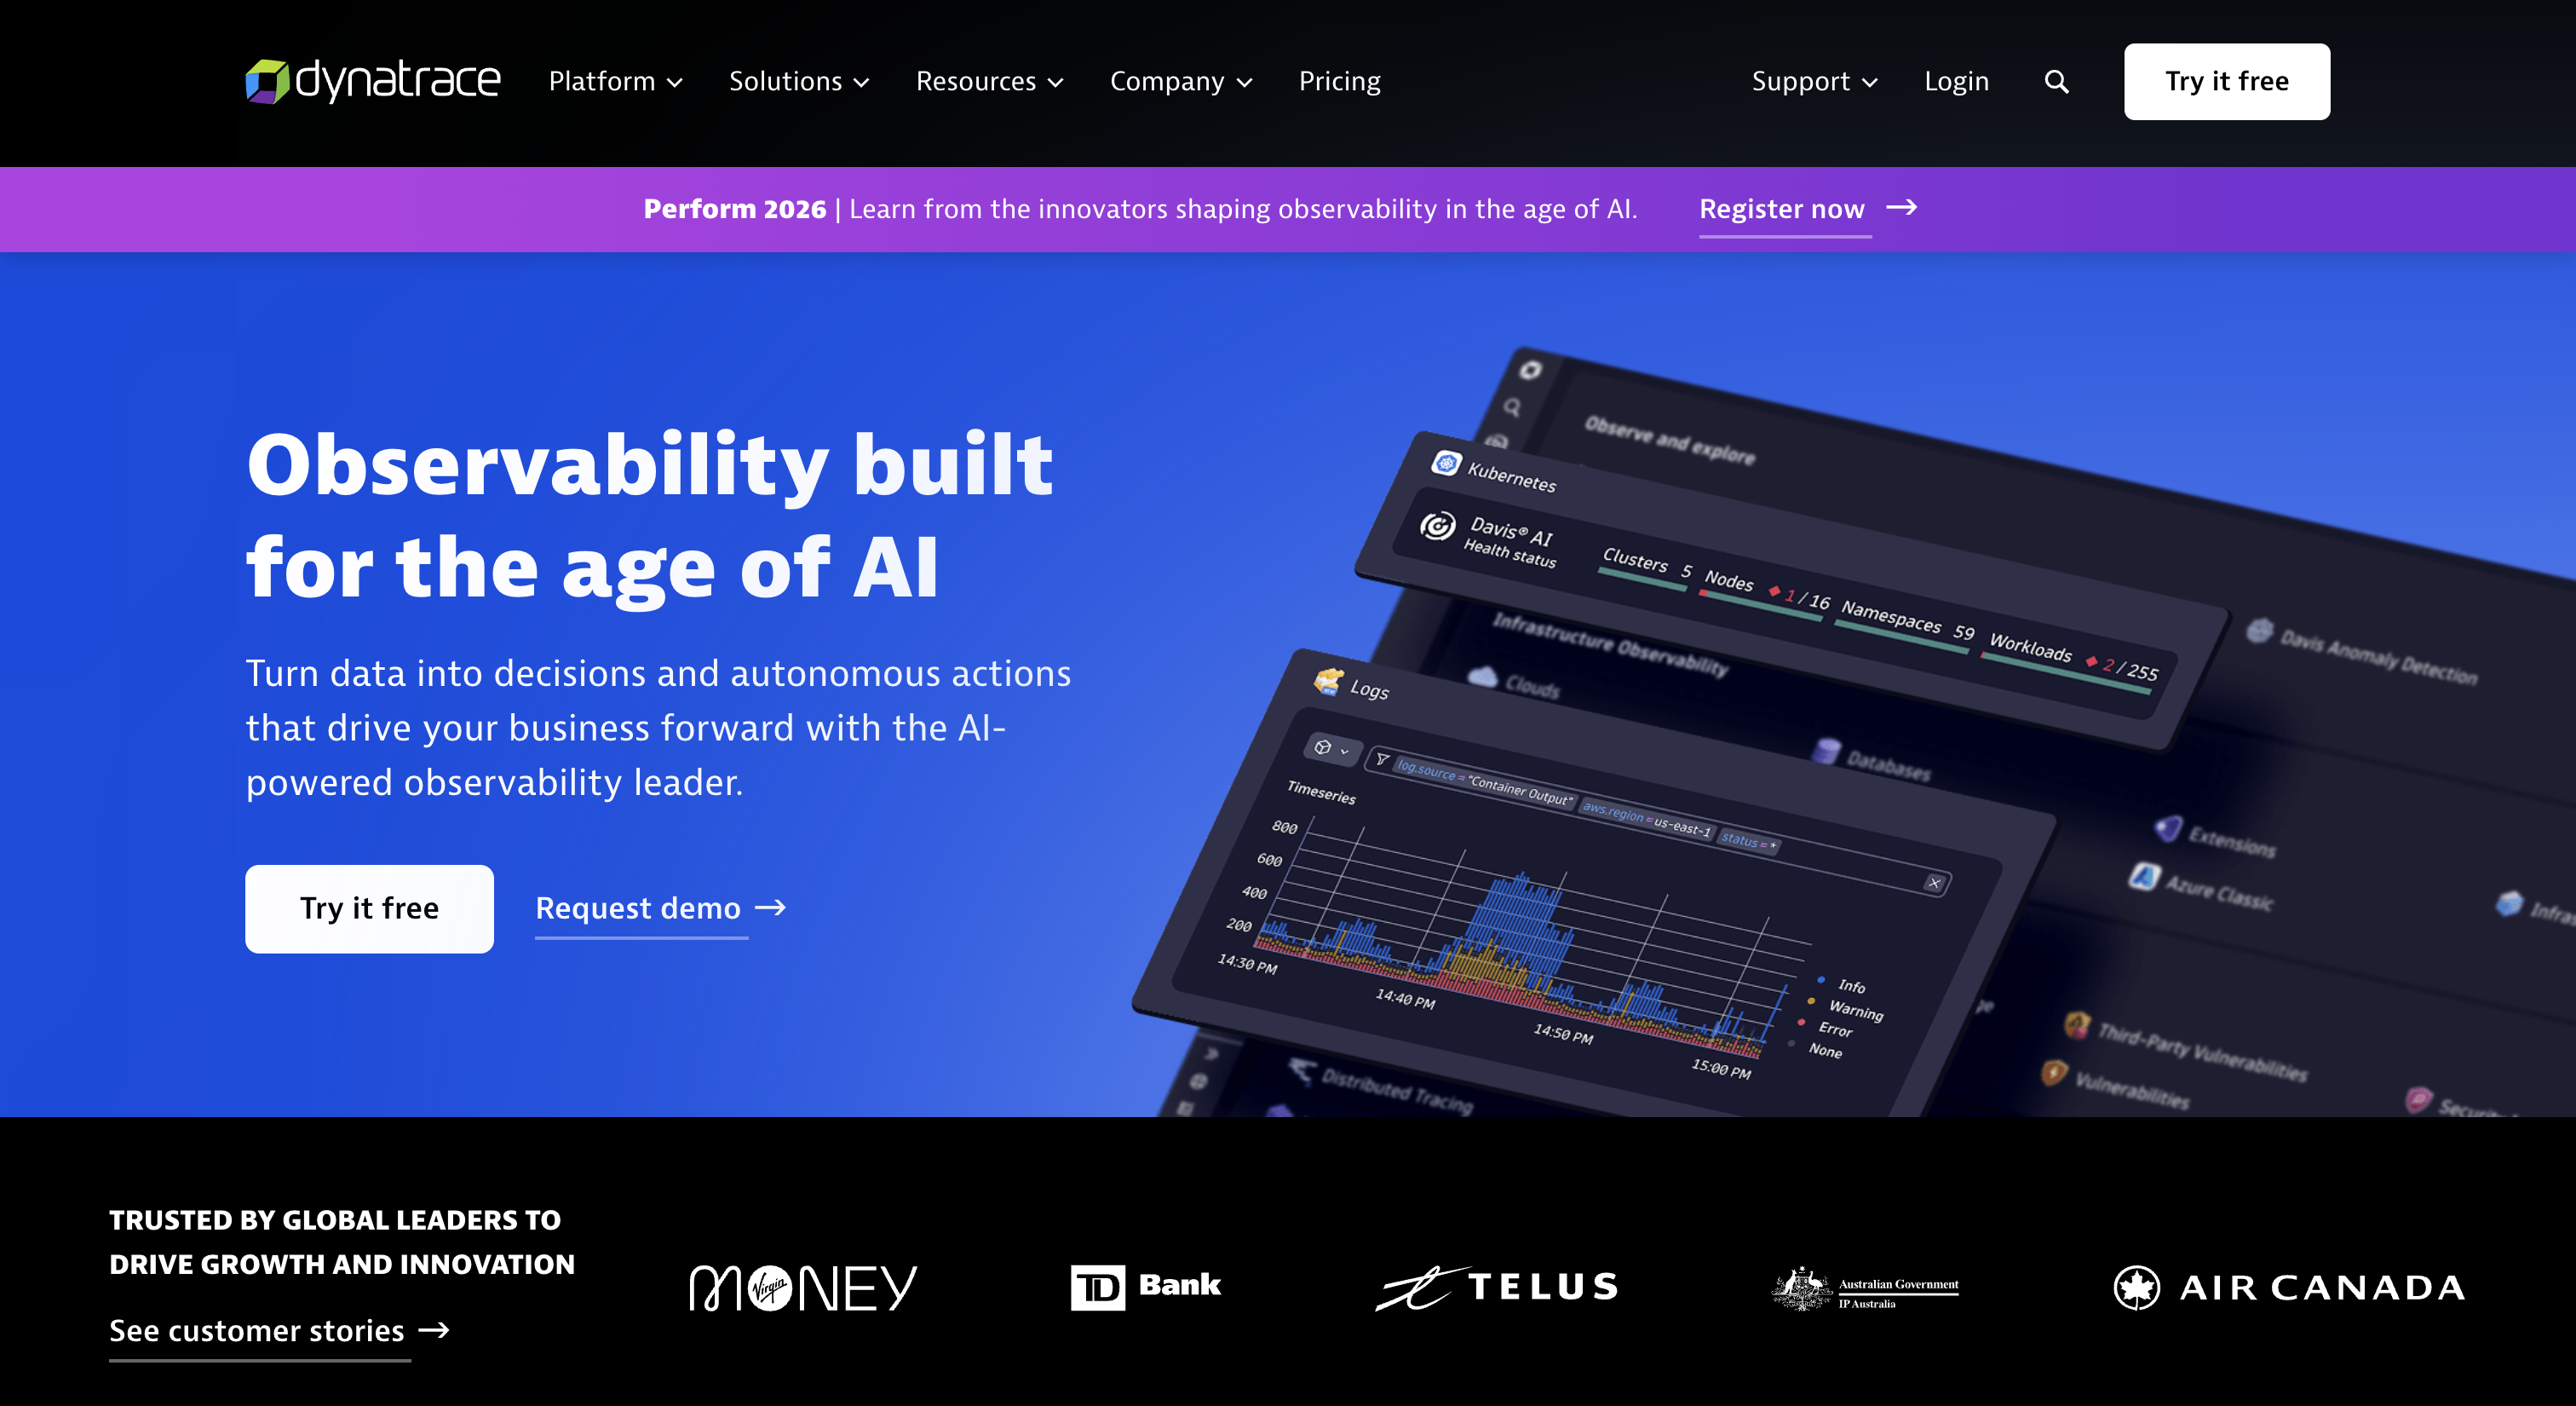
Dynatrace is an enterprise observability platform built around automation and AI-driven insights. It is designed for complex environments where manual instrumentation becomes difficult to manage.
Teams adopt Dynatrace to reduce operational overhead. APIs, services, and dependencies are automatically discovered and monitored, with AI surfacing root causes instead of raw signals. For API observability, Dynatrace shines in automatic detection and diagnosis, but offers less manual control for teams that prefer hands-on configuration.
Key Features:
- Automatic instrumentation: APIs and services are detected and monitored without manual agents or configuration.
- AI-driven root cause analysis: Dynatrace’s Davis AI automatically identifies where and why API performance degrades.
- Code-level API visibility: Drill down into API execution paths, database calls, and third-party dependencies.
- Service dependency mapping: Automatically visualises how APIs interact across services and infrastructure.
- Experience & business context: Links API issues to user experience and business impact.
Pros:
- Very low operational overhead once deployed
- Excellent for large, complex enterprise environments
- Strong AI-driven diagnostics
Cons:
- Less flexible for teams that want manual control
- Can feel opaque due to heavy automation
Ideal for:
Large enterprises that want automated API observability with minimal hands-on tuning.
5. Splunk Observability Cloud (SignalFx)
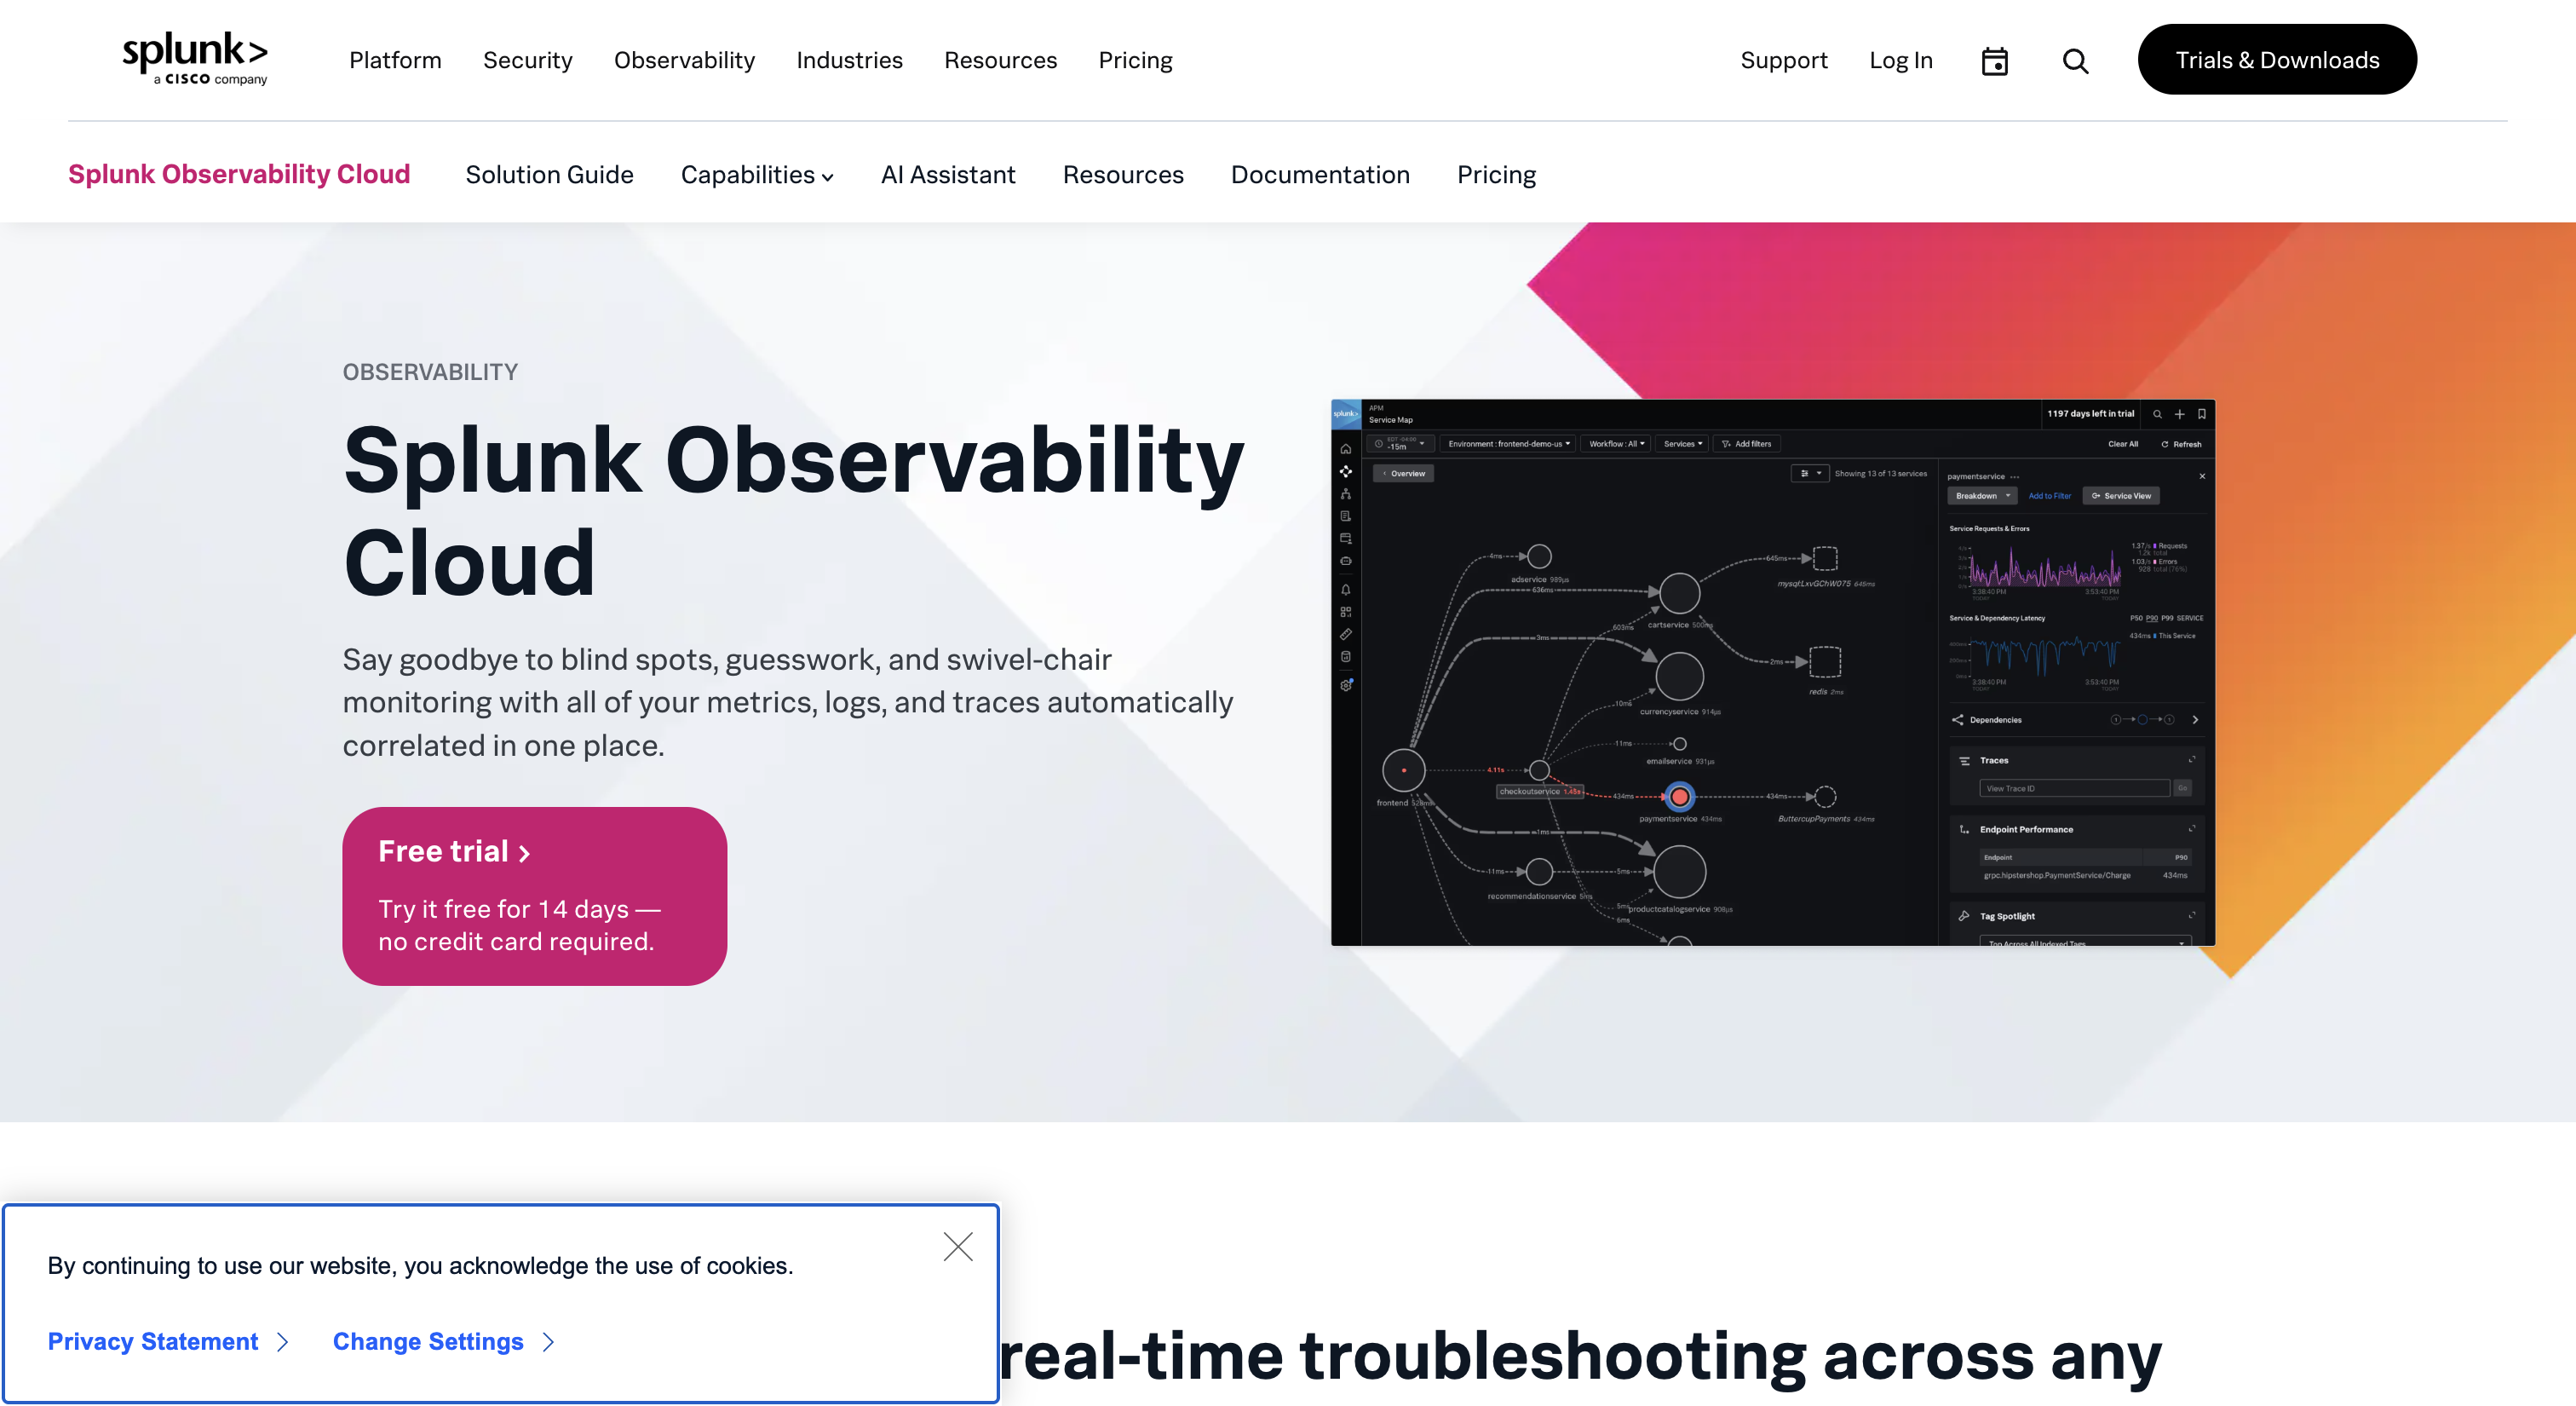
Splunk Observability Cloud is built for real-time monitoring of cloud-native and microservices-based systems. It focuses heavily on high-volume metrics and streaming analytics.
Teams use it when they need instant visibility into API performance as traffic patterns change. It’s especially effective in fast-moving, event-driven environments. From an API perspective, Splunk excels at real-time metrics and tracing, but feels less cohesive when it comes to full lifecycle visibility.
Key Features:
- Real-time metrics monitoring: Capture and analyse API latency, error rates, and throughput in near real time.
- Distributed tracing: Trace API requests across microservices using OpenTelemetry standards.
- Streaming analytics: Analyse metrics continuously rather than in delayed batches.
- Infrastructure correlation: Tie API performance issues back to underlying cloud resources.
- OpenTelemetry-first approach: Native support for modern instrumentation pipelines.
Pros:
- Excellent real-time visibility
- Strong fit for microservices and cloud-native stacks
- Good OpenTelemetry ecosystem support
Cons:
- Logs, metrics, and traces feel less unified than competitors
- Costs increase quickly with data volume
Ideal for:
Cloud-native teams that prioritise real-time API performance monitoring.
6. Prometheus & Grafana
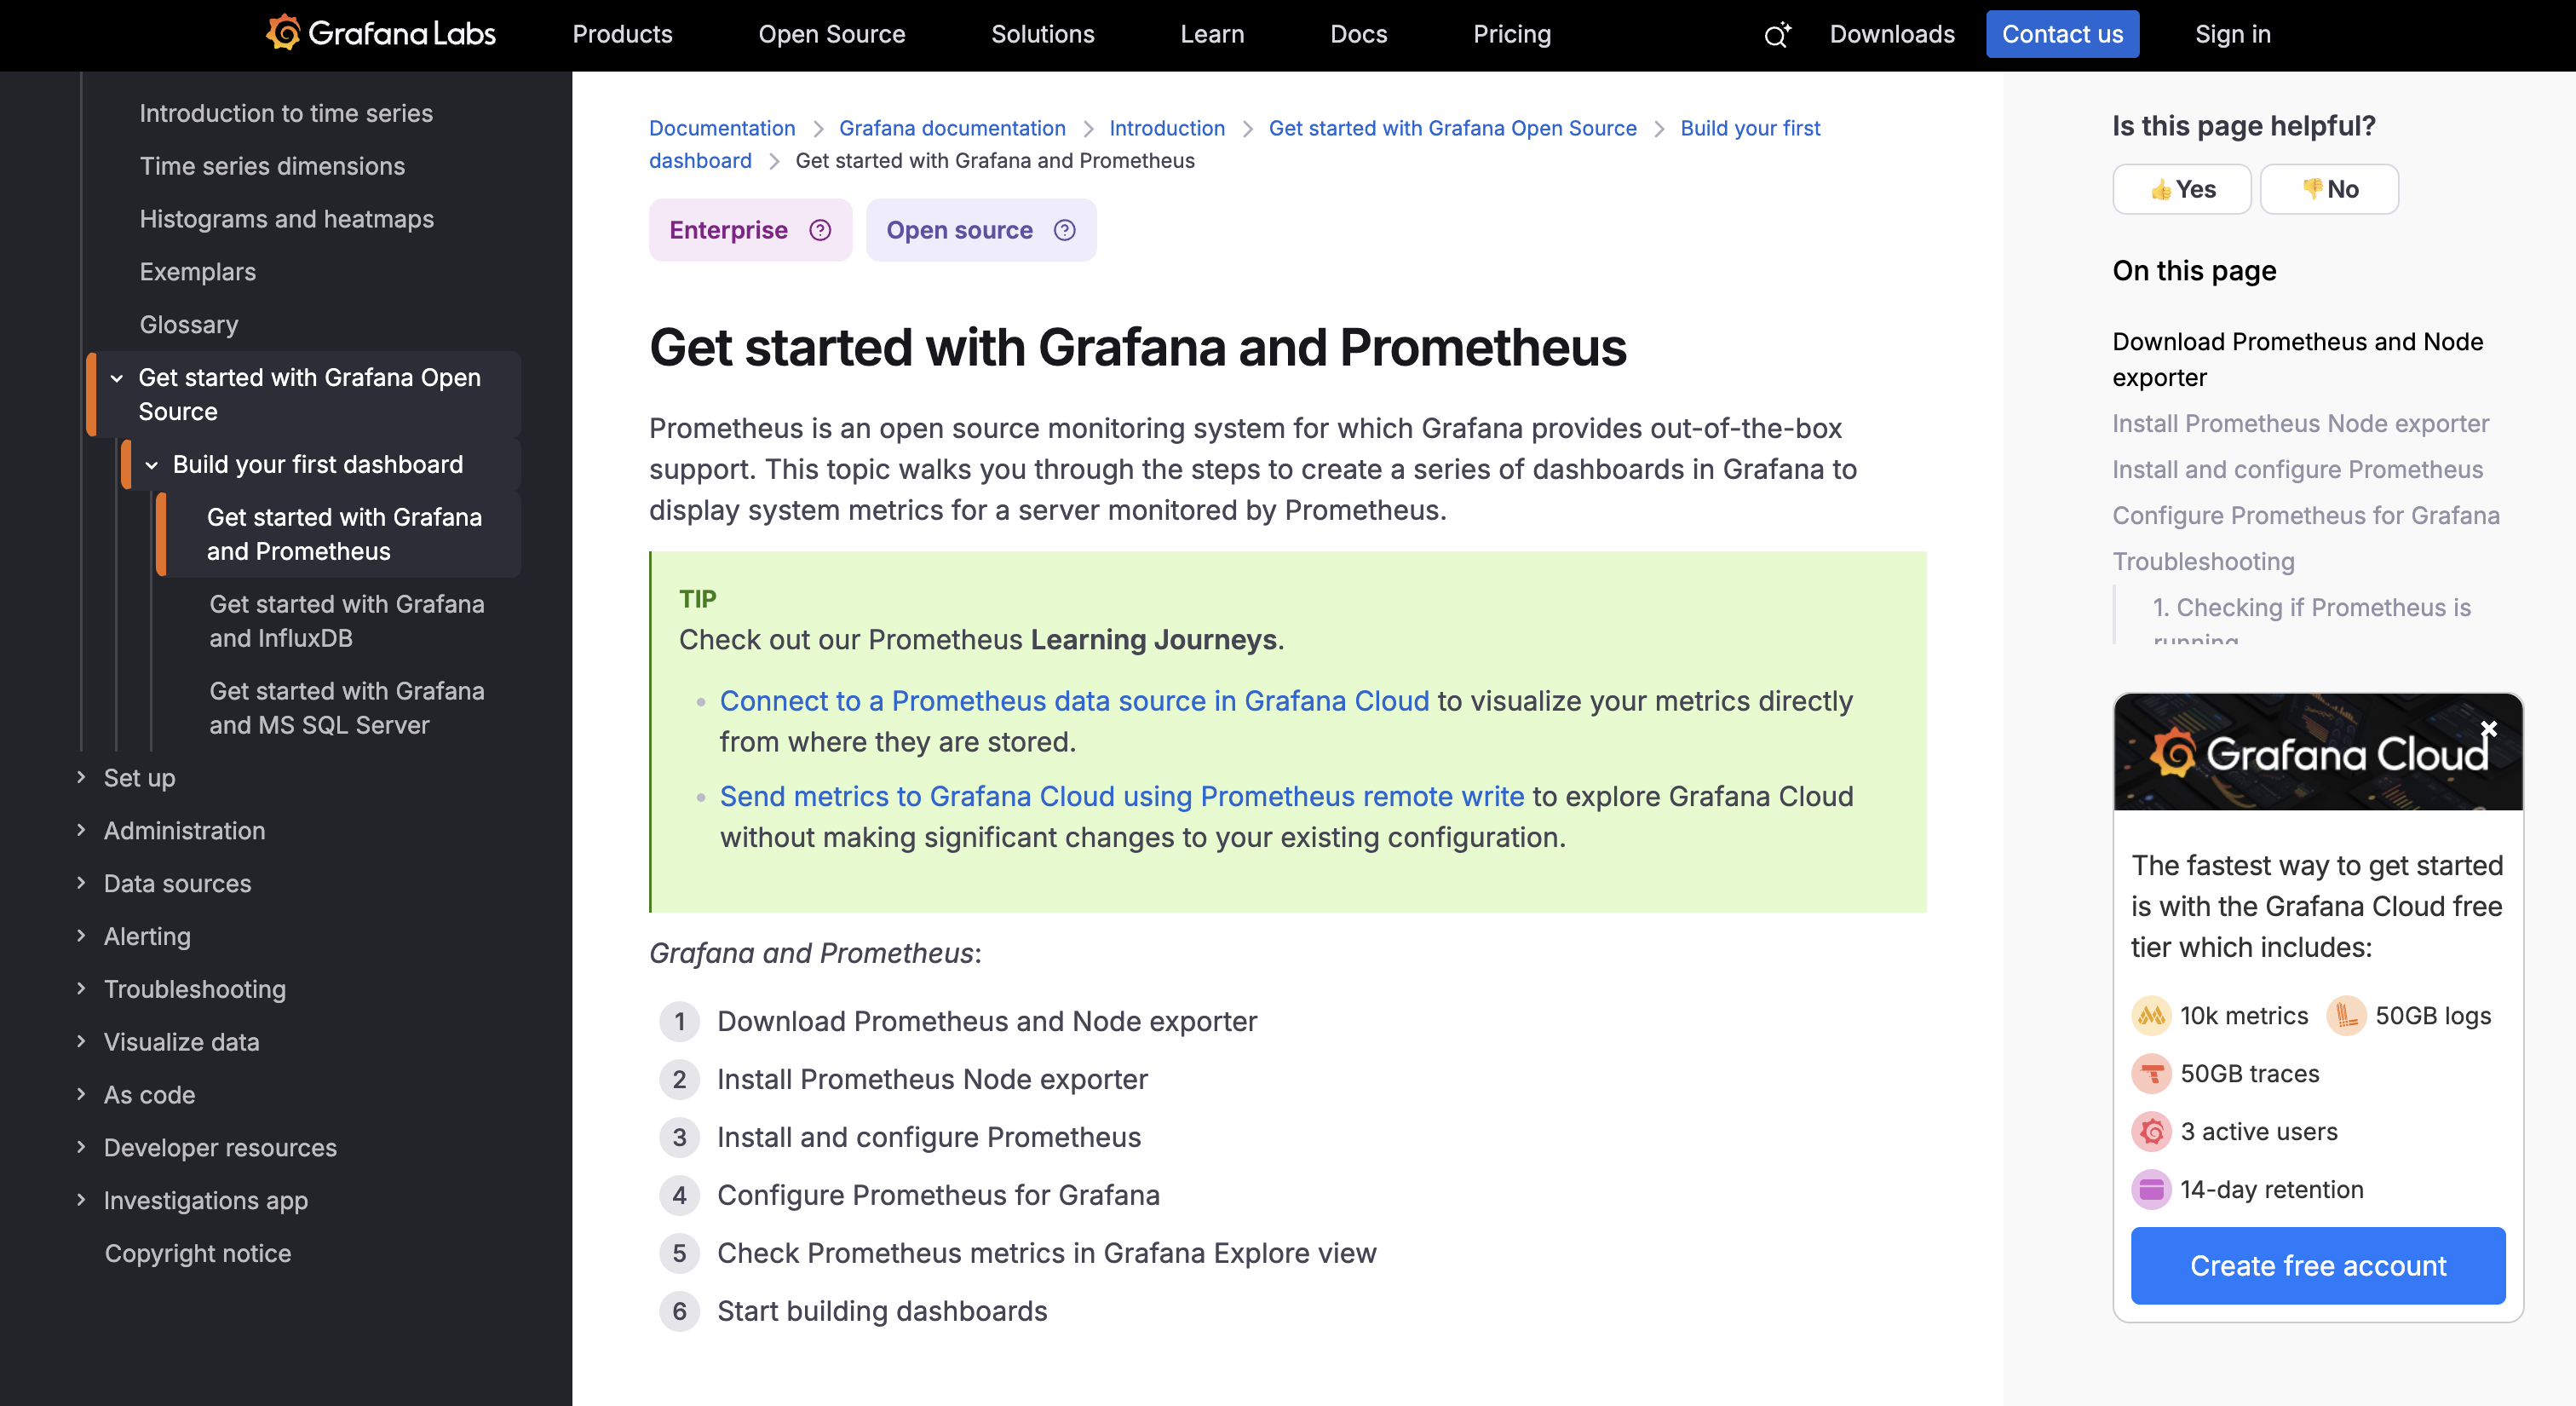
Prometheus and Grafana together form one of the most widely adopted open-source observability stacks in modern engineering teams. Prometheus focuses on collecting and querying time-series metrics, while Grafana provides flexible dashboards and visualisation on top of that data.
Teams typically adopt this stack when they want full control over how metrics are collected, stored, and visualised. It’s commonly used in Kubernetes-heavy environments where teams prefer open standards and deep customisation over managed platforms.
Key Features:
- Metrics-based API monitoring: Track request rates, error counts, and latency using time-series data.
- PromQL querying: Perform flexible, fine-grained analysis of API performance metrics.
- Alerting rules: Define custom thresholds for API availability and latency.
- Custom dashboards: Build highly tailored API monitoring views in Grafana.
- Extensive exporter ecosystem: Integrate with gateways, services, and infrastructure tools.
Pros:
- Open-source and cost-efficient
- Extremely flexible and customisable
- Strong community and ecosystem
Cons:
- Requires significant setup and maintenance
- Lacks native API-level context without extensions
Ideal for:
Teams with strong DevOps maturity that want maximum control over API metrics.
7. Honeycomb
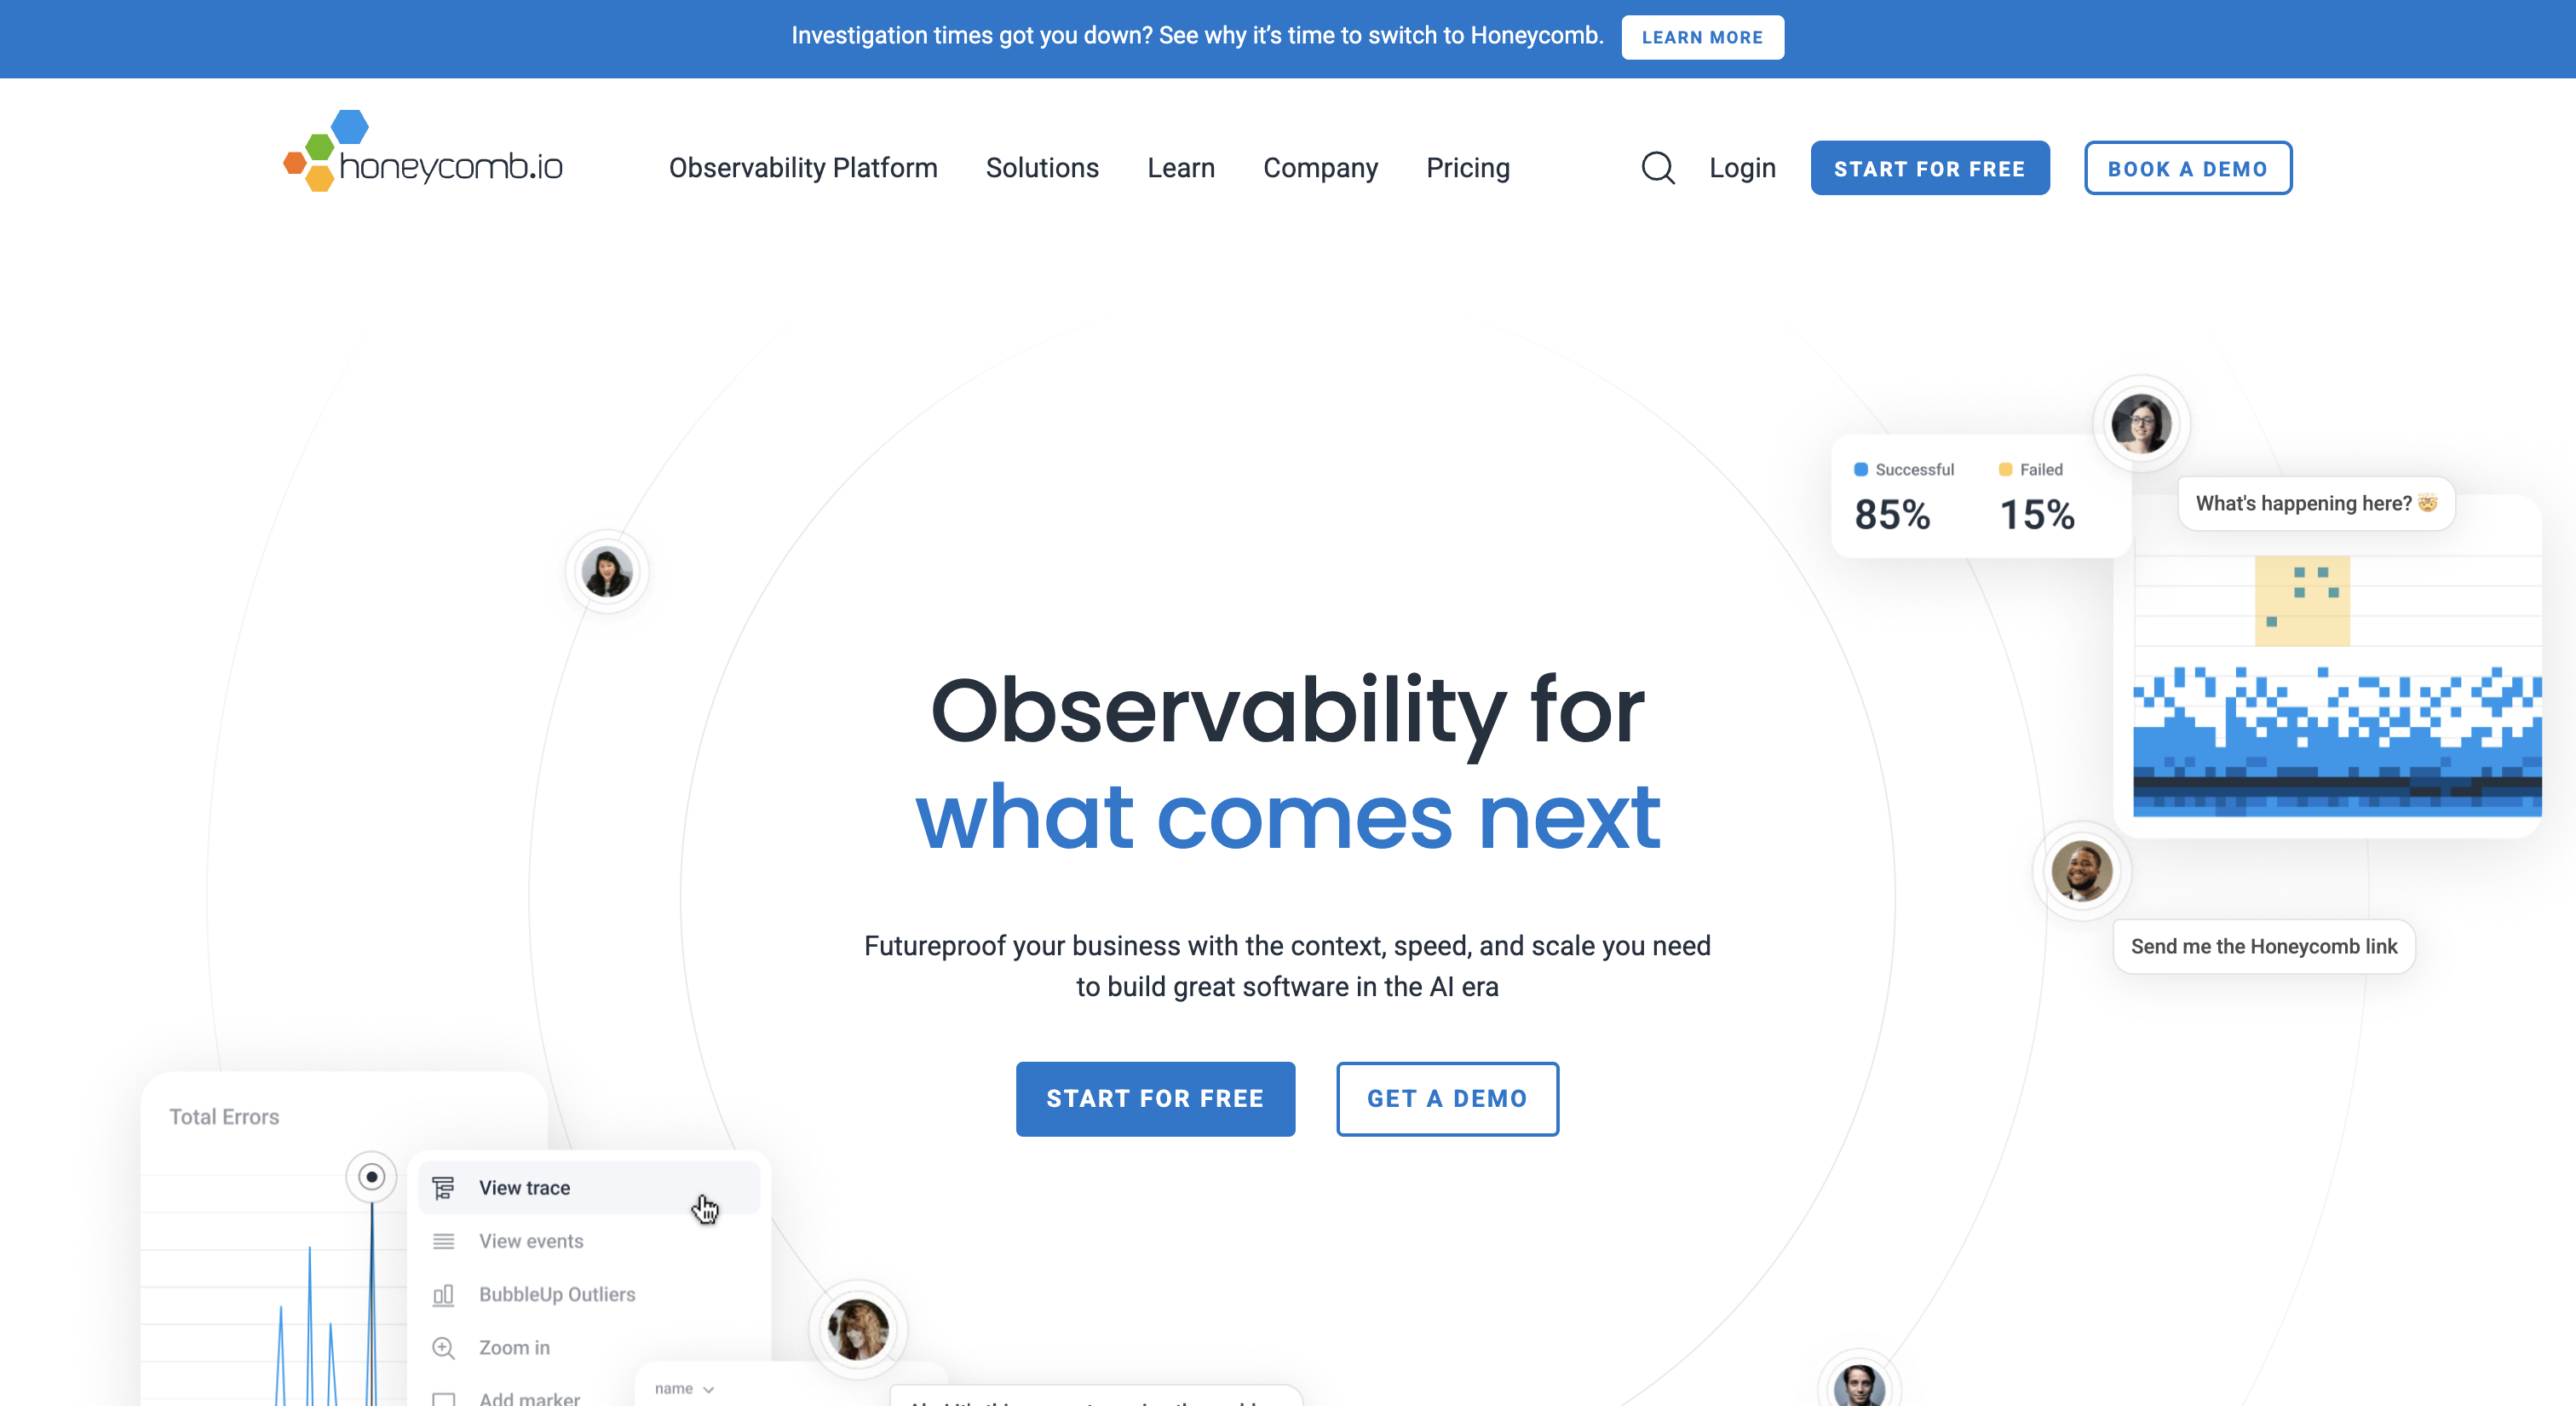
Honeycomb is an observability platform designed to help teams understand why systems behave the way they do, not just whether they are up or down. It was built specifically for debugging complex, distributed systems.
Engineering teams use Honeycomb when traditional dashboards stop being useful. Instead of predefined charts, teams explore API behaviour dynamically by slicing data across many dimensions like user IDs, endpoints, or request attributes.
Key Features:
- High-cardinality tracing: Analyse API requests across user IDs, endpoints, and custom attributes.
- Structured events: Capture rich API execution context instead of raw logs.
- Exploratory querying: Ask open-ended questions about API behaviour without pre-built dashboards.
- BubbleUp analysis: Automatically highlights what changed during failures or latency spikes.
- Service maps: Visualise how APIs interact across distributed systems.
Pros:
- Exceptional for deep API debugging
- Handles complex, high-dimensional data well
- Encourages investigative workflows
Cons:
- Not suited for simple monitoring needs
- Requires a learning curve and mindset shift
Ideal for:
Engineering teams debugging complex API and microservices behaviour at scale.
8. Lightstep (ServiceNow Observability Cloud)
Lightstep is a tracing-first observability platform focused on understanding how requests move through distributed systems. It helps teams visualise and analyse the full journey of a request across microservices.
Teams adopt Lightstep when distributed tracing is their primary concern, especially in environments where APIs call many downstream services and latency sources are hard to pinpoint. From an API observability standpoint, Lightstep provides excellent end-to-end request visibility, but it is narrower in scope compared to full-stack observability platforms.
Key Features:
- End-to-end distributed tracing: Follow API requests across services and infrastructure.
- Dependency mapping: Visualise upstream and downstream API relationships.
- Latency and anomaly detection: Identify abnormal behaviour in API request paths.
- Metrics and logs correlation: Add supporting context to traces.
- OpenTelemetry-native instrumentation: Built for modern observability standards.
Pros:
- Best-in-class distributed tracing
- Strong OpenTelemetry alignment
- Clear visibility into API call paths
Cons:
- Narrower scope than full-stack platforms
- Less suited for infra-heavy monitoring
Ideal for:
Teams that prioritise tracing and API dependency visibility over broad observability.
9. AppDynamics (Cisco)

AppDynamics is an application performance monitoring platform designed to connect application and API performance with business outcomes. It is widely used in large enterprises where APIs power critical workflows.
Teams use AppDynamics to monitor APIs not just for latency or errors, but for how they impact user experience and revenue-driving transactions. This business context is one of its key differentiators. For API observability, AppDynamics excels at transaction-level monitoring, though it feels less modern for cloud-native or highly dynamic environments.
Key Features:
- Business transaction monitoring: Track end-to-end API-driven workflows.
- Code-level diagnostics: Inspect API execution paths and bottlenecks.
- End-to-end tracing: Follow API calls across tiers and services.
- Infrastructure correlation: Link API issues to infrastructure health.
- User experience monitoring: Understand how API performance affects users.
Pros:
- Strong business context
- Deep code-level insight
- Proven enterprise adoption
Cons:
- UI feels dated
- Less optimised for cloud-native-first teams
Ideal for:
Enterprises that need to tie API performance directly to business outcomes.
10. Akita Software
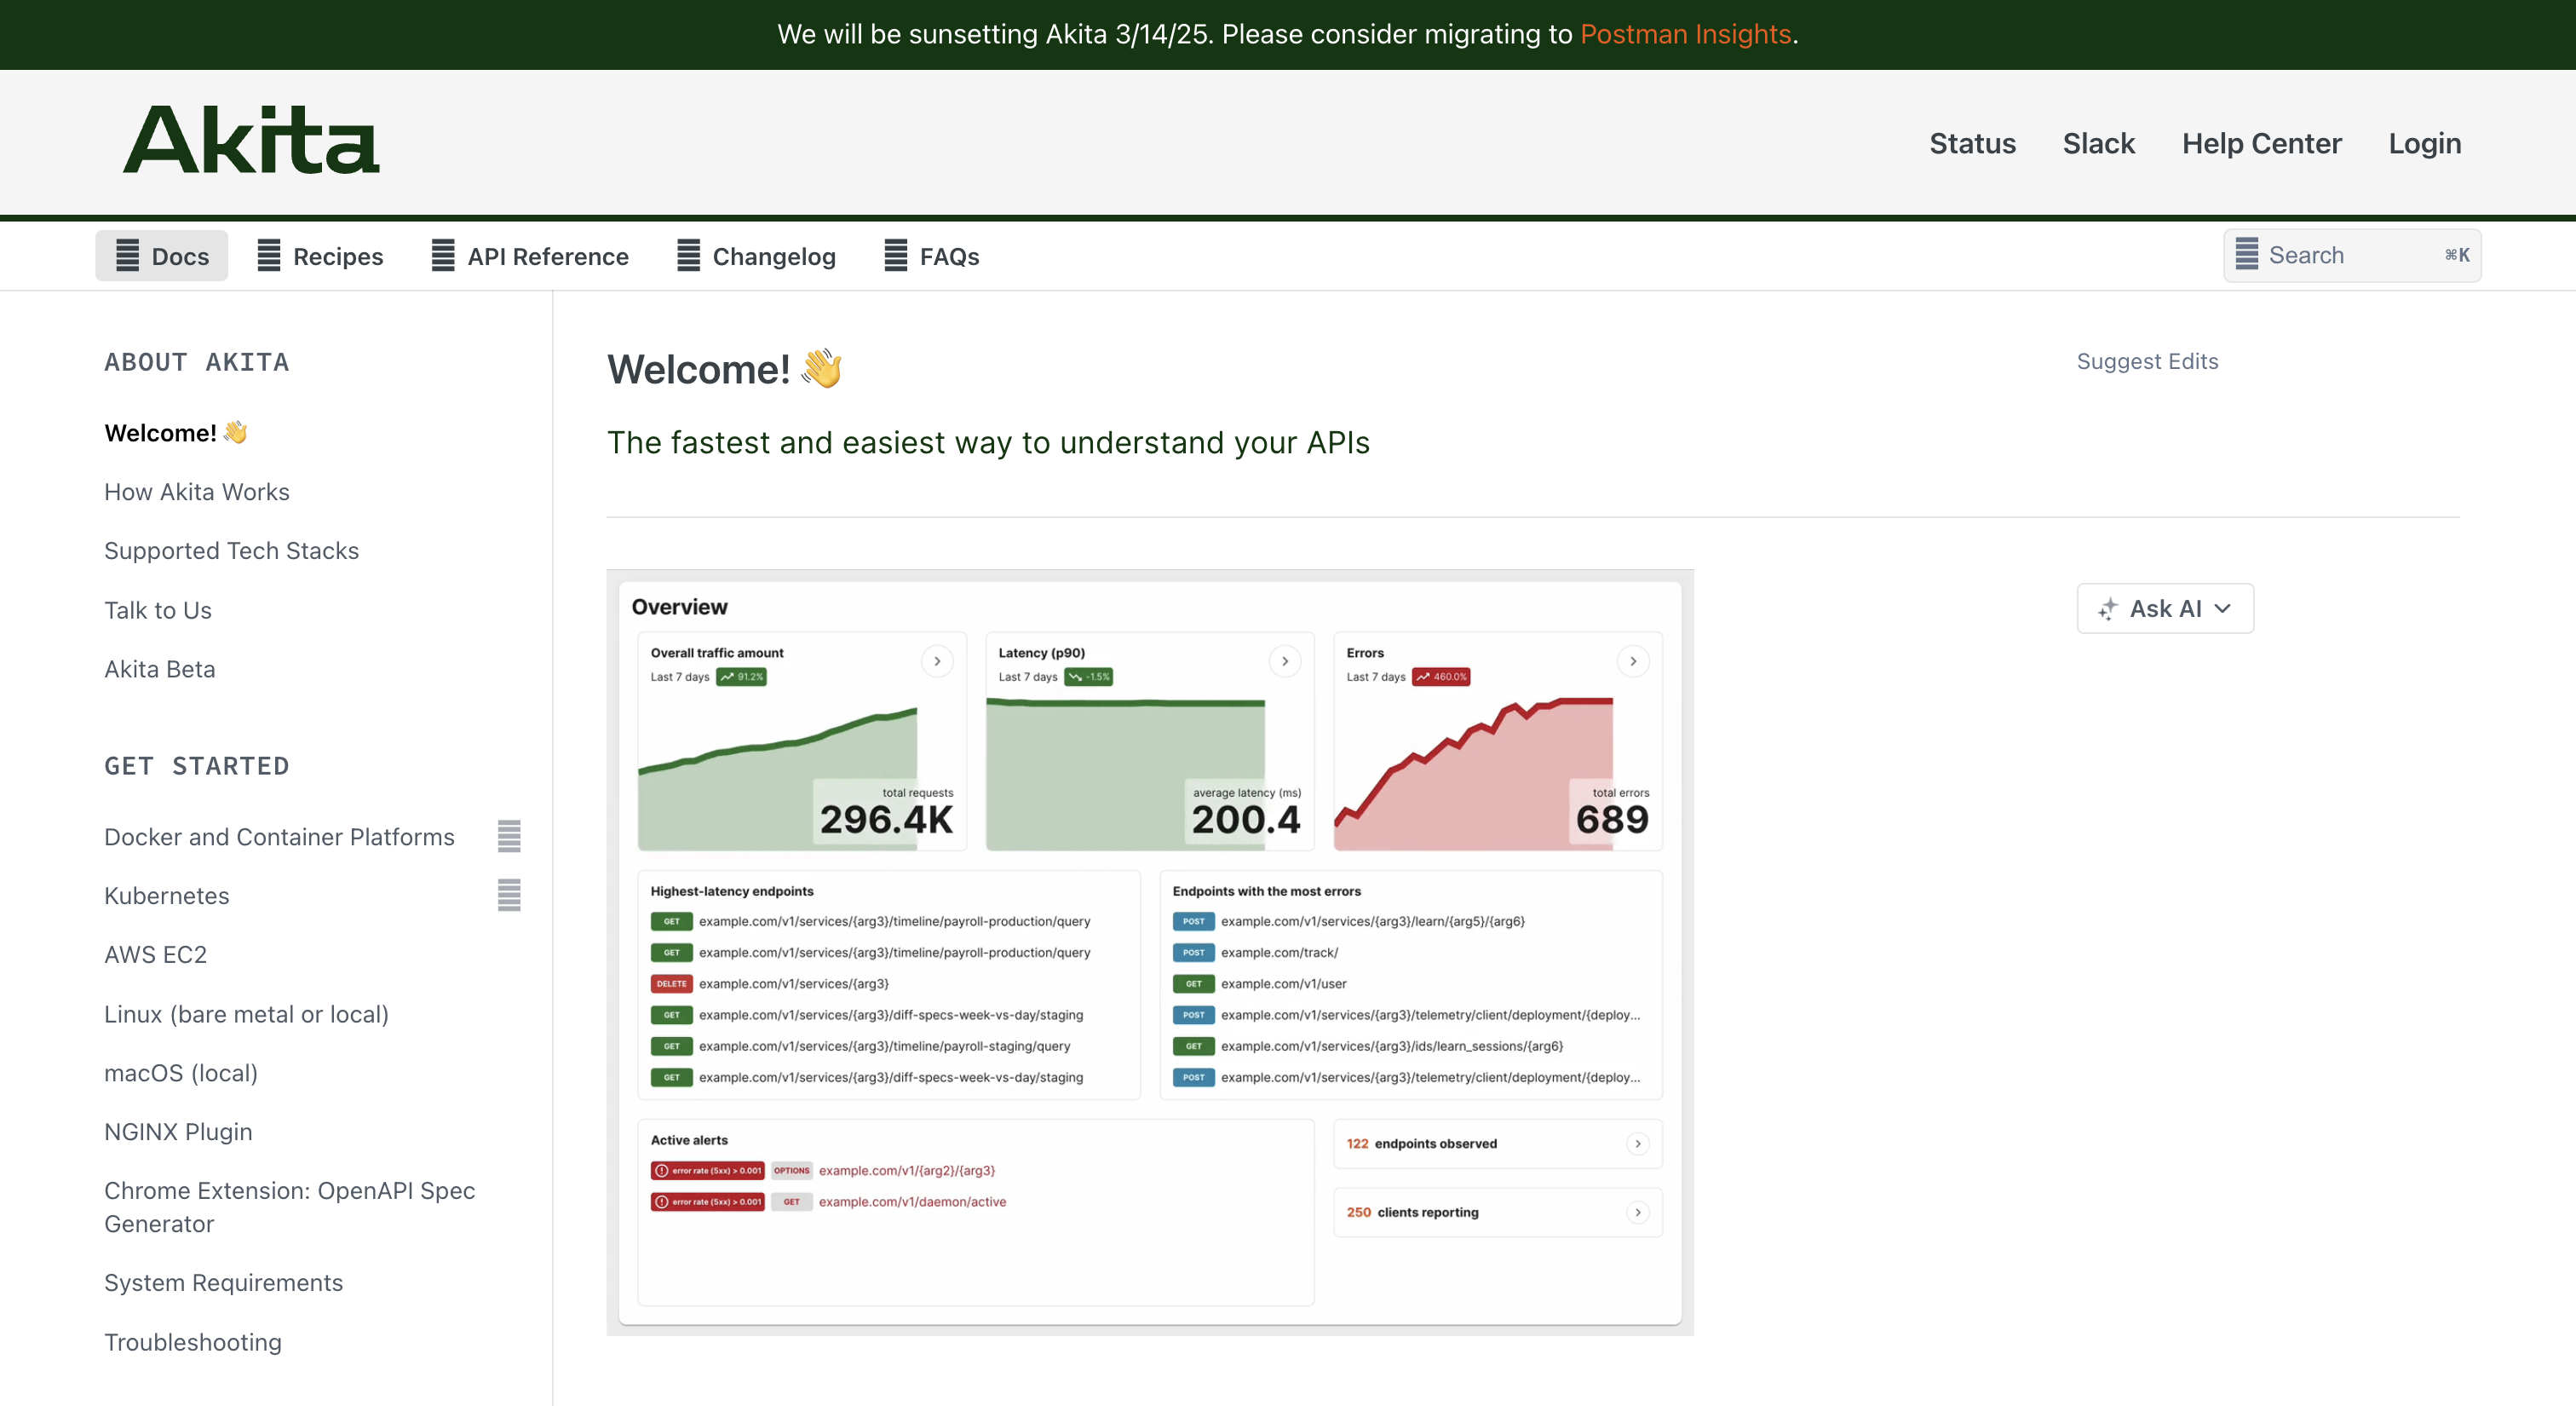
Akita is an API observability tool that takes a different approach by analysing network traffic instead of relying on code-level instrumentation. It observes real API interactions as they happen in production.
Teams use Akita to quickly understand API behaviour in environments where documentation is missing, outdated, or constantly changing. This is especially useful in large or legacy systems. From an API observability lens, Akita provides fast, high-level visibility into API behaviour, but does not aim to replace deeper runtime or code-level monitoring tools.
Key Features:
- Traffic-based API visibility: Observe APIs without deploying agents or modifying code.
- Automatic API specification generation: Build and update schemas from real usage.
- Change detection: Identify breaking and behavioural changes in APIs.
- Anomaly detection: Spot unusual API behaviour in real time.
- Low-friction deployment: Gain insight quickly with minimal engineering effort.
Pros:
- Fast time-to-value
- Excellent for API discovery and change tracking
- No instrumentation required
Cons:
- Limited code-level visibility
- Not a full observability stack
Ideal for:
Teams that need fast, high-level API visibility without deep instrumentation.
Why is API Observability Crucial in 2026?
As API-driven architectures become the backbone of almost every digital service, the stakes for API performance and reliability have never been higher. In 2026, strong API observability isn't just a best practice; it's a fundamental requirement for competitive advantage and operational resilience.
Ensuring Reliability and Performance
APIs are the direct interface to your services. Any degradation in their performance translates immediately into a degraded user experience, impacting customer satisfaction and potentially revenue. Observability tools continuously track key performance indicators (KPIs) like latency, error rates, and throughput, allowing teams to detect subtle shifts before they escalate into major incidents. This real-time insight is vital for maintaining service level agreements (SLAs) and ensuring consistent, reliable performance.
Accelerating Error Detection and Troubleshooting
In complex distributed systems, identifying the root cause of an error can be like finding a needle in a haystack. A single user request might traverse dozens of microservices, third-party APIs, and data stores. Observability provides the contextual data—correlated logs, detailed traces, and performance metrics—that significantly reduces mean time to resolution (MTTR). Engineers can quickly pinpoint which specific service or component introduced the error, drastically speeding up debugging and recovery.
Strengthening Security and Compliance Posture
Observable APIs make it easier to detect anomalous behavior that could indicate a security threat or compliance violation. Unusual traffic patterns, unauthorized API calls, or unexpected data access can be flagged in real-time. By tracking who accessed what, when, and from where, observability contributes to a robust security posture and helps meet regulatory compliance requirements by providing auditable trails of API activity.
Optimizing Resource Utilization and Cost
Poorly performing APIs can waste significant computational resources, especially in cloud environments where resource consumption directly correlates with cost. Observability insights help identify inefficient API calls, redundant processes, or underutilized infrastructure. By optimizing API performance and resource allocation, organizations can reduce operational costs, making their cloud spend more efficient and sustainable.
Enhancing Developer Experience and Productivity
When APIs are opaque, developers spend undue time debugging, testing, and understanding system behavior. With robust observability, developers gain immediate feedback on their code, understand how changes impact the wider system, and quickly identify issues in development or production. This empowers them to build more resilient APIs, iterate faster, and deliver higher-quality software.
Key Considerations When Choosing an API Observability Tool
Selecting the right API observability tool is a strategic decision that impacts development speed, operational efficiency, and overall system reliability. Here are crucial factors to consider:
1. Scalability and Performance
Your chosen tool must be able to handle the volume and velocity of data generated by your APIs. As your services grow, the observability platform should scale effortlessly without becoming a bottleneck itself. Consider its ability to process high-cardinality data, handle peak loads, and store historical data for long-term analysis.
2. Integration Ecosystem
A robust observability tool should integrate seamlessly with your existing technology stack, including cloud providers, API gateways, CI/CD pipelines, and other monitoring or alerting systems. Look for native integrations or strong OpenTelemetry support to minimize setup complexity and ensure comprehensive data collection.
3. Ease of Use and Learning Curve
The tool should be intuitive for your engineering teams, offering clear dashboards, understandable visualizations, and straightforward query capabilities. A steep learning curve can hinder adoption and delay incident response. Prioritize user-friendly interfaces that enable quick data exploration and actionable insights.
4. Distributed Tracing Capabilities
For microservices architectures, distributed tracing is non-negotiable. Ensure the tool provides clear, end-to-end traces of API requests across all services. This is fundamental for diagnosing latency issues, understanding service dependencies, and pinpointing the exact source of errors in complex distributed systems.
5. Cost and Licensing Models
Evaluate the total cost of ownership, including licensing fees, data ingestion costs, retention policies, and support. Some tools charge per host, per GB of logs, or per million traces. Understand the pricing model thoroughly to avoid unexpected expenses as your API usage and data volume grow.
6. Open Source vs. Commercial Solutions
Decide whether an open-source solution (like Prometheus/Grafana) or a commercial product (like Datadog or New Relic) best fits your needs. Open-source offers flexibility and cost control but often requires more in-house management. Commercial solutions provide comprehensive features, support, and managed services but come with higher price tags.
Conclusion
API observability has evolved from a nice-to-have to a foundational pillar of modern software engineering. The complexity of today's distributed systems demands more than just basic uptime monitoring; it requires deep, contextual insights into every API interaction. The tools we've explored—from full-stack commercial powerhouses like Datadog and Dynatrace to flexible open-source combinations like Prometheus and Grafana—offer varying approaches to achieve this visibility.
By carefully considering your organization's specific needs for scalability, integration, ease of use, and budget, you can select an observability solution that empowers your teams to build, deploy, and maintain robust API ecosystems. Embracing robust API observability is not just about preventing outages; it's about fostering innovation, accelerating development, and ensuring superior digital experiences for your users.
FAQs
1. What is API observability?
API observability is the ability to understand the internal state of your APIs by analyzing the data they produce, primarily logs, metrics, and traces. It helps you understand not just if an API is working, but why it's behaving in a certain way, enabling faster debugging and proactive performance optimization.
2. How does API observability differ from API monitoring?
API monitoring typically focuses on predefined health checks and alerting on known issues (e.g., "is the API up?"). API observability goes deeper, enabling exploration of unknown issues and complex behaviors (e.g., "why is the API slow for this specific customer segment?"). It provides context, not just status.
3. What are the key components of API observability?
The key components include metrics (time-series data like latency, error rates), logs (timestamped records of events), and traces (the end-to-end path of a single request across multiple services). Together, these provide a comprehensive view of API performance and behavior.
4. Why is distributed tracing important for API observability?
Distributed tracing is crucial for microservices architectures because it visualizes the entire journey of an API request across multiple services. This helps identify which specific service or dependency is causing latency or errors, greatly reducing the time needed to diagnose problems in complex systems.
5. Can I achieve API observability with open-source tools?
Yes, open-source tools like Prometheus (for metrics) and Grafana (for visualization) offer powerful capabilities for API observability. However, they often require more manual setup, configuration, and maintenance compared to commercial, all-in-one platforms which provide managed services and extensive features out-of-the-box.
Dhayalan Subramanian is Associate Director, Product Growth at DigitalAPI, where he leads go-to-market and product growth for the company’s multi-gateway API management platform. His work focuses on helping large enterprises and mid-market cloud companies consolidate APIs across AWS, Azure, Apigee, Kong, MuleSoft, and other gateways into a single control plane for governance, discovery, monetization, and agent consumption.
Dhayalan brings 14+ years of experience across product strategy, enterprise architecture, and engineering leadership. Earlier in his career, he held senior roles at Encora (as Associate Architect and Technical Manager), Mindtree (Technology Lead), Tech Mahindra (Technical Lead), and Primus Analytics, where he designed integration frameworks and delivered enterprise-grade digital platforms for global customers.
At DigitalAPI, he works directly with platform, integration, and developer experience leaders at Fortune 500 organizations to operationalize unified API catalogs, developer portals, and MCP-ready APIs. He writes regularly on API developer experience, API governance, and AI agent architectures.

One email a fortnight. Worth opening.
A short digest of what we're writing, what we're learning from customers, and the handful of links you'd actually want from us. No tracking pixels.
.avif)