


API Developer Experience Metrics: How to Measure DX Beyond Time to First Call
The 12 API developer experience metrics to track from discovery to retention, with formulas, data sources, a time-to-first-call method, a survey template and a scorecard.


TL;DR: What are API developer experience metrics?
API developer experience metrics show how easily outside developers find, adopt and keep using your APIs. Track 12 across the journey: docs-to-sign-up conversion, catalog search success, sign-up completion, time to credentials, time to first call, first-call success, 7-day activation, early error rate, time to production, active developers, tickets per active developer and satisfaction.
Combine product data with a short survey. Time to first call matters, but it can't show whether a developer stays, or who gave up before the first call.
Most API dashboards answer one question well: how much traffic did we serve? Traffic only shows the developers who made it. The partner who got a key, hit a 401 and went quiet never appears on the chart.
So, two counts.
First, how many developers got an API key last quarter? You can probably pull that number quickly. Now count how many of them made a second successful call within 7 days. Most teams have never counted the second number.
What are API developer experience metrics?
API developer experience metrics are measures of how easily developers outside your API team can find, adopt and keep using your APIs. They follow a developer from first visit to live integration. The term "developer experience metrics" has a second, more common meaning, so it helps to separate the two.
This guide covers the right-hand column. One idea carries over from the DevEx research: friction shows up through feedback loops, cognitive load and flow state. For an API consumer, that means clear error messages, docs that don't make you guess, and no waiting on someone to approve a key.
Why do API developer experience metrics matter to the business?
They show where adoption, revenue and support costs are being won or lost before a contract or invoice shows it. Leaders rarely fund "better developer experience" on its own. They fund more activated partners, faster revenue and fewer tickets, so translate each metric into one of those.
Worked example (illustrative numbers): 200 partner developers sign up in a year. Activation rises from 30% to 40%, which adds 20 activated developers. If 10% of those reach paid production at $20,000 a year, that's about $40,000 in new yearly revenue.
Use your own numbers, and show the assumptions. A simple estimate that finance can check beats a large one nobody believes.
Which metrics matter most for internal, partner and public APIs?
The right metrics depend on who consumes the API. Internal developers need to find what already exists, partners need to get live, and public developers need to succeed alone. Measure each audience separately, because a combined number hides all three.
Which API developer experience metrics should you track?
Track 12 metrics across six stages, from discovery to sentiment. Together they show where developers stop, not only how many arrive. The formulas below are our recommended definitions, so adapt them to your data, then keep them fixed so trends stay comparable.
Discover: can developers find the right API?
Low numbers here mean developers can't tell whether you have what they need. Postman's 2025 State of the API report found that 34% of respondents can't find existing APIs and 55% struggle with inconsistent documentation. That survey covers teams collaborating on APIs, but outside developers face the same problem with less context.
- 1. Docs-to-sign-up conversion shows whether your docs persuade a developer to try the API. It misleads when docs are public and well indexed, because search visitors who only wanted one answer pull the rate down.
- 2. Catalog search success rate shows whether developers find what they search for. It misleads when a page view follows a bad result, so also track repeat searches and searches with no results.
Onboard: how long until they can try it?
These metrics show the wait before any code runs. The failures here never reach your gateway, so traffic dashboards can't show them.
- 3. Sign-up completion rate catches failed confirmation emails and identity errors. It misleads when bots inflate sign-ups, so filter them before you read the number.
- 4. Time to credentials exposes hidden manual steps, such as a key request sitting in someone's inbox. It misleads when you average self-serve and approved access together, so report each separately.
First call: does the first attempt work?
Speed and success belong together. A fast first call that fails isn't a good experience.
- 5. Time to first call shows how quickly a developer gets a working result. The next section covers how to calculate it, and where it misleads.
- 6. First-call success rate shows whether your auth docs and sample requests work as written. It misleads when pre-filled sandbox calls count, so report sandbox and developer-written calls separately.
Integrate: does the trial become real work?
This is where interest turns into adoption. Many developers try an API once. Far fewer build on it.
- 7. 7-day activation rate separates curiosity from intent. Seven days suits most self-serve APIs. Partner integrations move more slowly, so use a longer window for them, and don't compare the two.
- 8. Early error rate shows whether your docs match how the API behaves. It misleads when you count 429 rate-limit errors or expected 404s, so break it down by status code.
- 9. Time to production shows the distance from a working test to a live integration. It misleads when legal or procurement delays sit outside your control, so record which step took the time.
Retain and support: do developers stay?
Keeping a developer is the outcome the other metrics serve.
- 10. Active developers shows who's still building or running on your API. It misleads when one automated job keeps an abandoned integration "active", so also track call volume and the number of endpoints used.
- 11. Tickets per active developer shows how much hand-holding the API needs. Read it with retention: few tickets and few active developers isn't success.
Sentiment: how did it feel?
Sentiment explains what the logs can't. A developer can succeed and still decide never to use your API again.
- 12. Developer satisfaction score shows why the other numbers look the way they do. It misleads when only your happiest developers reply, so also survey developers who stopped. The survey section below has a template.
For operational numbers such as latency and uptime, see our guide to API metrics.
What is time to first call, and how do you calculate it?
Time to first call (TTFC) is the time from a developer's starting point, usually sign-up, to their first successful API call. Report it as a median, alongside the share of developers who reach a first call at all. Sources disagree on when the clock starts, so state your start and stop points whenever you share the number.
Postman, which helped popularize the metric, starts the clock at "some point of discovery", such as a website visit or sign-up. Starting at sign-up is easier to measure, because you know who the developer is.
How to calculate it:
- Set the start: the sign-up timestamp from your portal.
- Set the stop: the first response with a 2xx status from that developer's credentials.
- Calculate each developer's time, then take the median.
- Report the reach: developers with a first successful call ÷ developers who signed up.
Worked example (illustrative numbers): eight developers sign up, and five reach a successful call, after 8, 12, 15 and 25 minutes, and 2 days.
- Median: 15 minutes.
- Average: about 9.8 hours, pulled up by one developer.
- Reach: 5 of 8, or 63%.
Reporting only "15 minutes" would hide the three developers who never got there.
How is it different from time to first hello world?
In practice, the two terms overlap. Time to first hello world (TTFHW) usually means reaching a first working result, while time to first call points at the API request itself. Pick one definition, write it down and use it consistently.
Why isn't time to first call enough?
- It ignores developers who quit. They have no first call to measure.
- A good quickstart can flatter it. A pre-filled sandbox call is fast, but it doesn't prove the developer can build with your API.
- It stops at the start. It says nothing about going live or staying.
To improve the number, see our guide to slashing time to first call.
Want to reduce your time to first call? See how to get developers from sign-up to a working call faster → Talk to our experts
How do you collect the data?
Connect your portal, gateway, ticket system and survey on one shared ID. Each tool sees one part of the journey. The metrics only work when you can follow the same developer or app through all of them, and this is the step most teams skip.
Watch for these traps:
- Shared keys. One key used by a whole partner team counts as one developer.
- Internal traffic. Exclude your own test accounts, or your numbers will look better than they are.
- People who never get a key. They're missing from gateway logs, so start the funnel from portal data.
- Several gateways. If your APIs sit on more than one gateway, normalize status codes and IDs first. Postman found in 2025 that 31% of organizations run more than one API gateway.
What events should you capture?
Record six events with the same IDs, and most of the 12 metrics become simple queries. Add a timestamp to each. These names are examples, so map them to whatever your tools already log.
Here's how median time to first call and reach might look in PostgreSQL, assuming a signups table with one app per account and a gateway_calls table. Treat it as a pattern and adapt it to your schema.
Our guide to API analytics KPIs covers more on usage tracking.
What should an API developer experience survey ask?
Ask about effort, documentation, what nearly stopped them, and whether they'd recommend you. Keep it short and send it at the moment the experience is fresh. Here's a template you can copy.
Question 1 adapts the Customer Effort Score, originally built for support interactions. Question 5 follows the Net Promoter Score format: the percentage scoring 9 or 10, minus the percentage scoring 0 to 6.
When to send it:
- After the first successful call: questions 1 to 4.
- After go-live: the full survey.
- Once a quarter, to active developers: the full survey, at most. Google surveys its own engineers quarterly, and Atlassian suggests at least twice a year. Outside developers owe you less patience, so don't send more often than you can act on the answers.
Read answers next to the logs. A low effort score with a high early error rate tells you what to fix first.
What is a good score for each metric?
For most of these metrics, no reliable public benchmark exists. We looked, and the numbers that circulate are mostly unsourced vendor claims. Set your own baseline, then track the trend. Here's what we could trace to a source.
How to set a baseline:
- Measure each metric for one full quarter, using a fixed definition.
- Split results by audience, such as partners, public developers and internal teams, because they behave differently.
- Pick the stage with the biggest drop, and set one improvement target for it.
- Compare against yourself each quarter.
How do you measure developer experience when AI agents are the developer?
Add metrics for failed tool calls, completed tasks and calls per task, and treat them as your own definitions. No standard exists yet for measuring agents as API consumers. The need is growing, though readiness isn't: Postman's 2025 report found that 89% of developers use AI, while only 24% actively design APIs with AI agents in mind.
Agents don't read a quickstart or file a ticket. They fail differently, so human metrics such as satisfaction don't transfer.
Anthropic's guidance on writing tools for agents suggests collecting runtime, the number of tool calls, token consumption and tool errors. If you use the Model Context Protocol (MCP), the specification marks failed tool runs with isError: true, which gives you a clean signal to count.
How do you turn these metrics into action?
Review a one-page scorecard each month, and give every weak number one likely cause, one fix and one owner. A metric nobody owns won't improve. Here's what one page can look like.
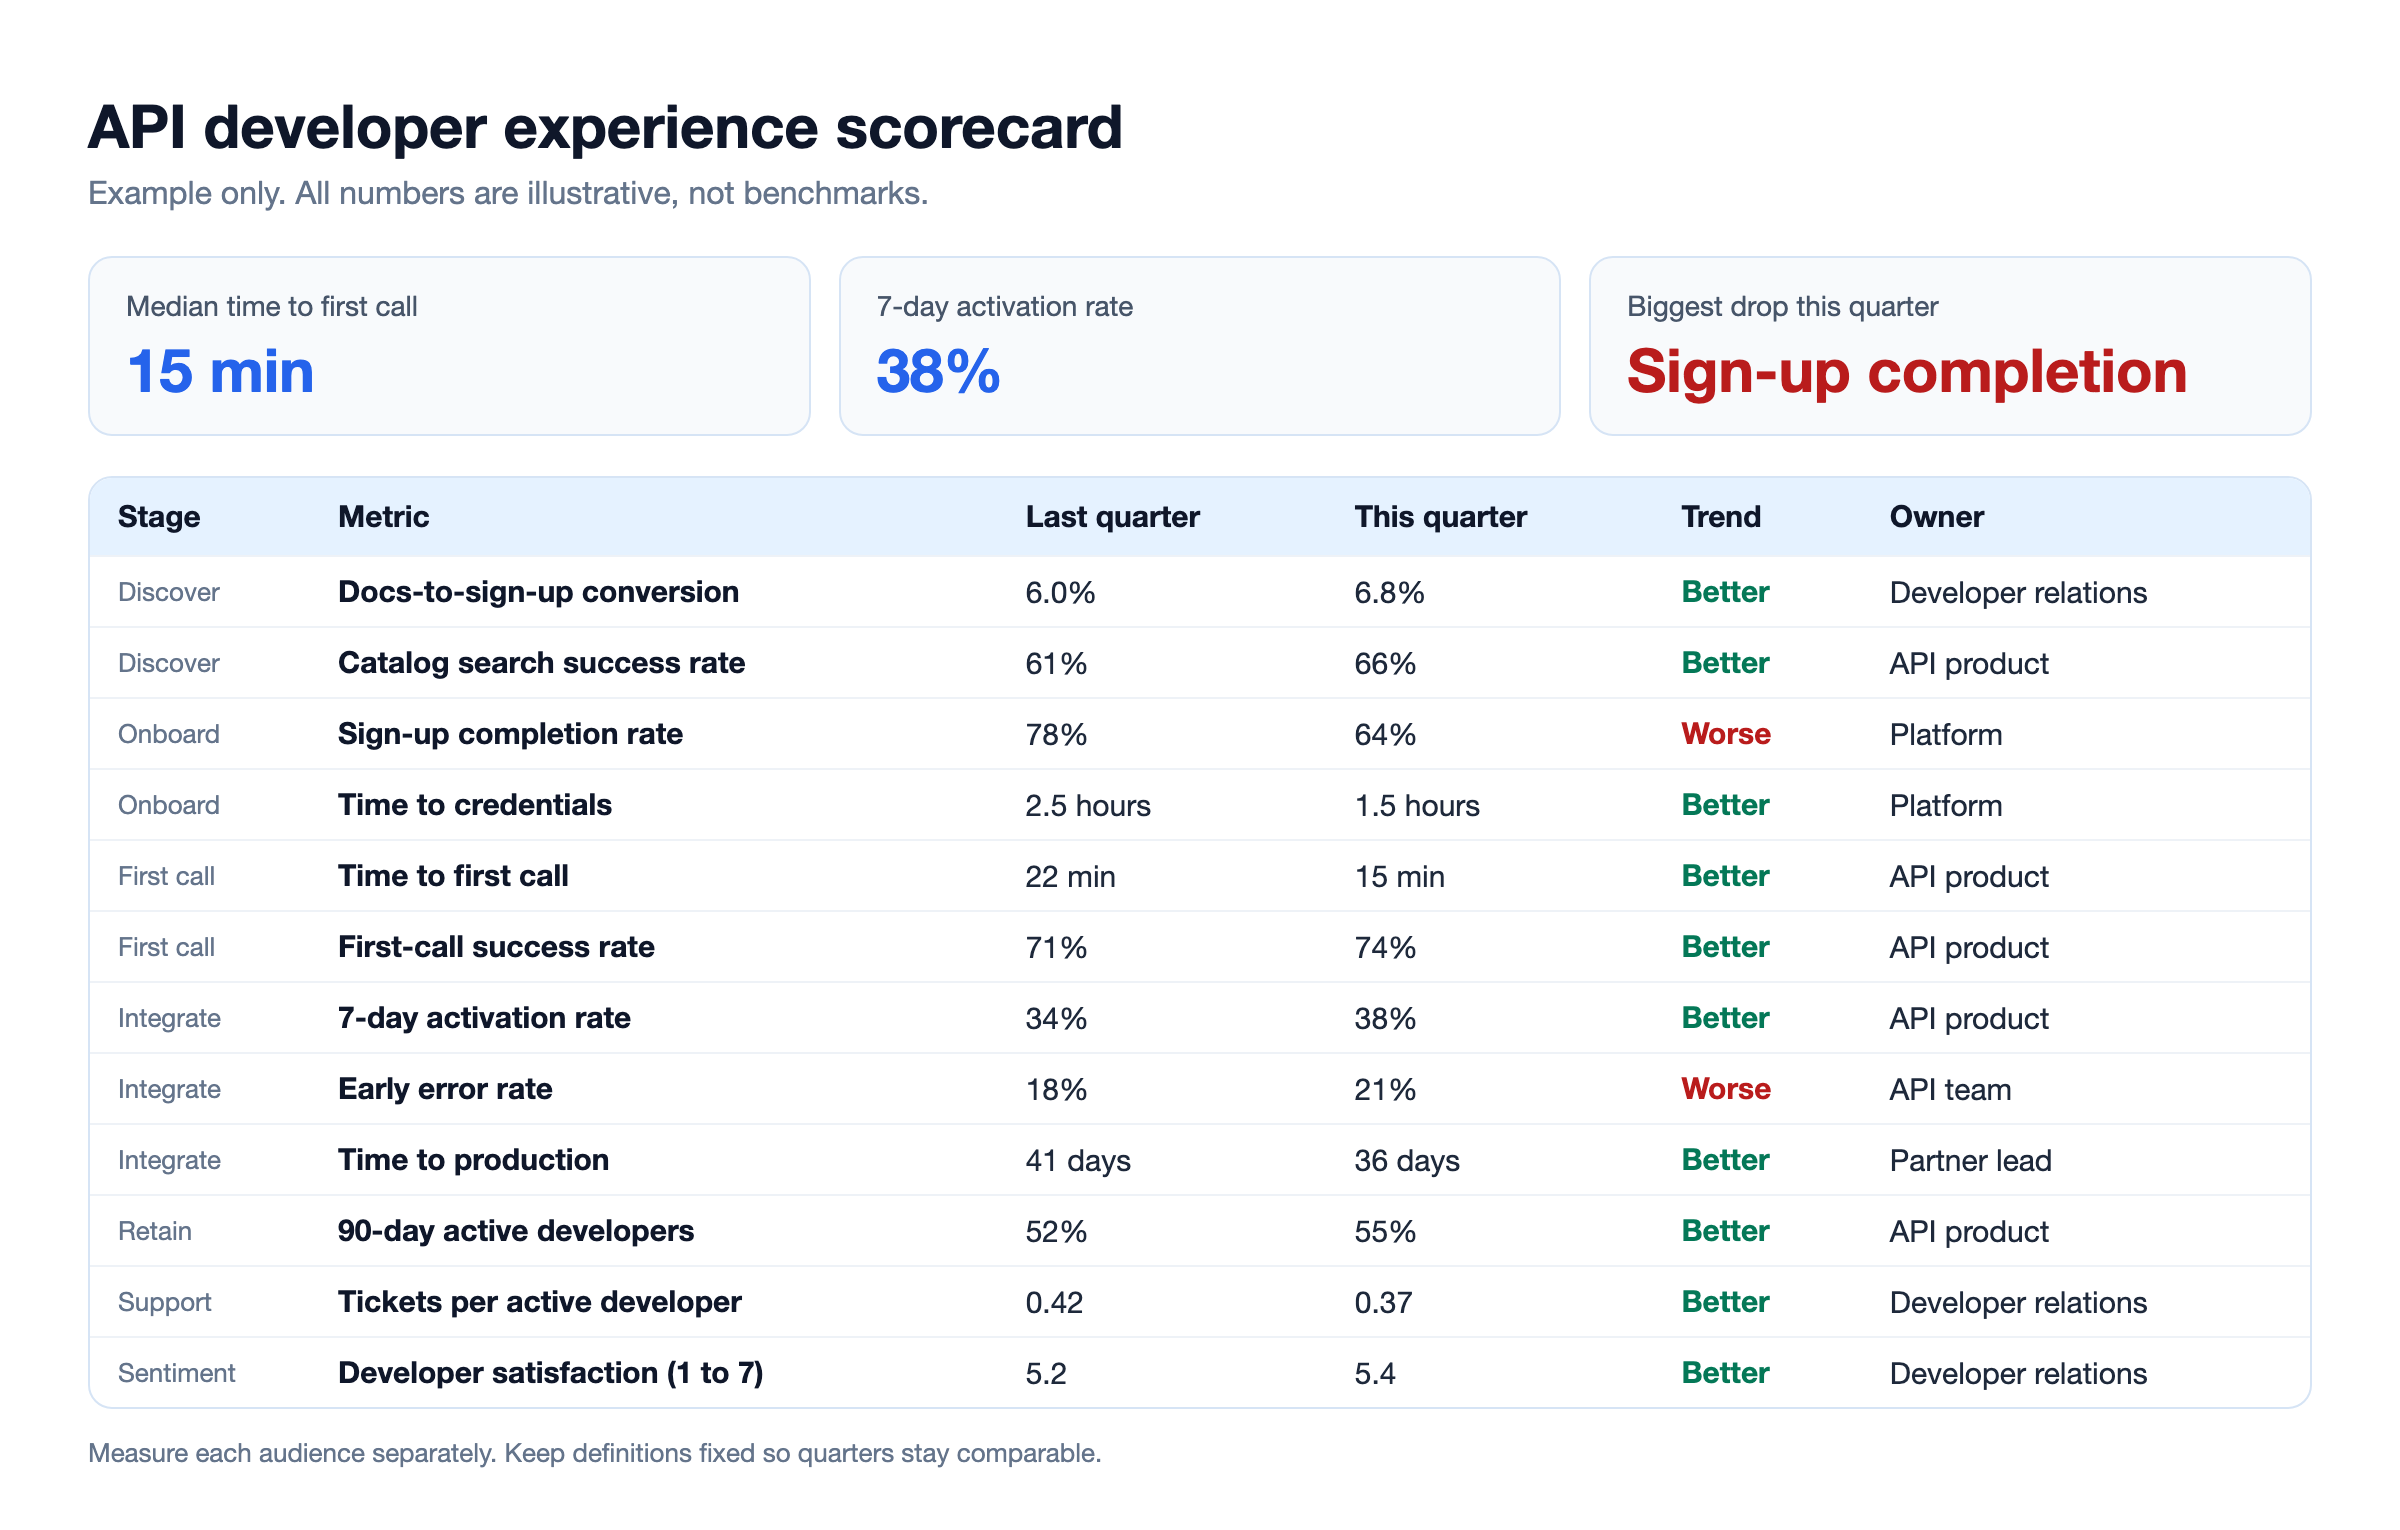
Then use this table to decide what to do about each weak number.
Start with 3 metrics if:
• You're early, or run a small public API. Track sign-up completion, time to first call and 7-day activation.
Add time to credentials, time to production and tickets if:
• You onboard partners by hand or under contract.
Track all 12 if:
• Your APIs earn revenue, or you run a developer program with its own team.
For the fixes themselves, see how to build a self-serve developer experience and why developer experience drives API adoption.
How does DigitalAPI help you measure API developer experience?
The hardest part of these metrics is getting one view of the journey, especially across gateways. A portal and gateway from different vendors rarely share IDs, which is why so many teams stop at traffic.
Teams using DigitalAPI see discovery, subscriptions and usage for APIs across their gateways in one place, without migrating off those gateways, so they can follow a developer from search to first call. Time to first call is the outcome the developer portal is built around, and API analytics show who's calling what.
Want to improve your API developer experience? See how to remove friction from discovery to go-live → Talk to our experts
FAQ
What are developer experience metrics?
Developer experience metrics measure how much friction developers face. The term has two meanings. Internal metrics, such as DORA and DevEx measures, track your own engineers' work. API developer experience metrics track outside developers adopting your APIs, using measures such as time to first call and activation.
How do you measure API developer experience?
Measure the journey with product data, then add a short survey. Track metrics from discovery to retention, including sign-up completion, time to first call, 7-day activation and tickets per active developer. Join portal, gateway and ticket data on one developer or app ID so you can follow each developer.
What is time to first call?
Time to first call is the time from a developer's starting point, usually sign-up, to their first successful API call. Report it as a median, and include the share of developers who reach a first call. State your start and stop points, because sources define them differently.
What is API activation rate?
API activation rate is the share of developers with credentials who reach a meaningful first milestone, such as a second successful call within 7 days. Define the milestone for your own API. Partner integrations need a longer window than self-serve APIs, so measure them separately.
What is a good time to first call?
No measured cross-industry benchmark exists, as of October 2026. Single-digit minutes is a common rule of thumb for self-service APIs, but it's opinion, not data. Complex or regulated APIs take longer. Measure your own median for a quarter, then work to reduce it.
What is the difference between DORA metrics and developer experience metrics?
DORA metrics measure software delivery performance inside an engineering team, such as deployment frequency and change lead time. Developer experience metrics measure friction. For APIs, that means friction for outside developers. A team can score well on DORA while its API remains hard to adopt.
What should a developer experience survey ask for APIs?
Ask how easy the first successful call was, whether the documentation was enough, what nearly stopped the developer, which step took longest, and how likely they are to recommend the API. Send it after the first call and after go-live, then at most once a quarter.
Which developer experience metrics matter most for partner APIs?
Time to credentials, time to production and tickets per active developer matter most for partner APIs. Partner integrations often take weeks or months, so 7-day activation and time to first call say less. Record which step causes each delay, including contract and security reviews.
How often should you review API developer experience metrics?
Review a scorecard monthly, and survey active developers no more than quarterly. Monthly reviews catch broken sign-up flows and rising error rates early. Quarterly baselines show the trend. Keep your metric definitions fixed, or the comparisons stop meaning anything.
Final word
- Measure the whole journey. Time to first call is one moment out of many.
- Count who stopped, not only who arrived. Start your funnel in the portal, before any key exists.
- Own every number. Give each weak metric one cause, one fix and one owner.
Start with the two counts at the top: keys issued last quarter, and second successful calls within 7 days.
Ready to improve developer experience across your APIs? See how DigitalAPI can help → Talk to our experts
Dhayalan Subramanian is Associate Director, Product Growth at DigitalAPI, where he leads go-to-market and product growth for the company’s multi-gateway API management platform. His work focuses on helping large enterprises and mid-market cloud companies consolidate APIs across AWS, Azure, Apigee, Kong, MuleSoft, and other gateways into a single control plane for governance, discovery, monetization, and agent consumption.
Dhayalan brings 14+ years of experience across product strategy, enterprise architecture, and engineering leadership. Earlier in his career, he held senior roles at Encora (as Associate Architect and Technical Manager), Mindtree (Technology Lead), Tech Mahindra (Technical Lead), and Primus Analytics, where he designed integration frameworks and delivered enterprise-grade digital platforms for global customers.
At DigitalAPI, he works directly with platform, integration, and developer experience leaders at Fortune 500 organizations to operationalize unified API catalogs, developer portals, and MCP-ready APIs. He writes regularly on API developer experience, API governance, and AI agent architectures.


One email a fortnight. Worth opening.
A short digest of what we're writing, what we're learning from customers, and the handful of links you'd actually want from us. No tracking pixels.