
API Analytics
Top API Metrics You Should Monitor for Performance
%20(1).png)
Updated on:
April 22, 2026

Imagine launching a rocket without a control panel. No fuel gauges, no speed trackers, just hope. Scary, right? Yet, that’s exactly what happens when you build APIs without monitoring the right metrics. Slow response times, crashing endpoints, and frustrated users sneak up on you, turning your powerful API into a ticking time bomb.
The truth? APIs aren’t "set and forget." To stay ahead, you need to track the right data—the heartbeat of your digital ecosystem. In this post, we’ll uncover the must-watch API metrics, why they matter, and how to avoid common pitfalls.
📋 Quick Summary in 60 Seconds
API Metrics Overview
Performance tracking: Measure response time, throughput, error rates, and latency to ensure APIs deliver fast, reliable user experiences
Usage analytics: Monitor requests per minute (RPM), active users, endpoint popularity, and traffic patterns to understand API adoption and demand
Infrastructure monitoring: Track CPU usage, memory consumption, uptime, and availability to maintain operational stability
Business intelligence: Measure developer onboarding speed, customer retention, revenue attribution, and ROI to align API success with business outcomes
Importance of Monitoring API Metrics
Prevents costly outages: Proactive monitoring helps identify issues before they become major problems that frustrate users and damage reputation
Drives informed decisions: Data-driven insights help optimize resource allocation, prioritize feature development, and scale infrastructure effectively
Measures business impact: Connects technical performance to revenue, customer satisfaction, and competitive advantage in the digital marketplace
Top Pain Points
Flying blind on performance: Many organizations lack visibility into API health, discovering problems only after users complain or systems crash
Metric overload confusion: Teams struggle to identify which metrics actually matter for their business goals versus tracking everything available
Siloed measurement approaches: IT teams focus on technical metrics while business teams need ROI data, creating gaps in understanding API value
How DigitalAPI Helps
Provides unified monitoring: Centralizes operational, adoption, and business metrics in a single dashboard for comprehensive API performance visibility
Delivers actionable insights: Advanced analytics identify performance bottlenecks, usage trends, and optimization opportunities that directly impact business outcomes
Enables strategic optimization: Comprehensive reporting helps teams align technical performance with business KPIs for maximum API program success
Final Note
API metrics aren't just numbers on a dashboard—they're the compass that guides your digital strategy. Whether you're optimizing for speed, scaling for growth, or proving business value, the right metrics framework transforms APIs from technical assets into measurable business drivers that fuel innovation and competitive advantage.
What are API metrics?
API metrics are measurable indicators that track the performance, usage, and health of an API. Common metrics include response time, error rate, request count, uptime, and latency. These metrics help developers monitor system behavior, diagnose issues, and optimize API efficiency and reliability.
Why monitoring API metrics is crucial
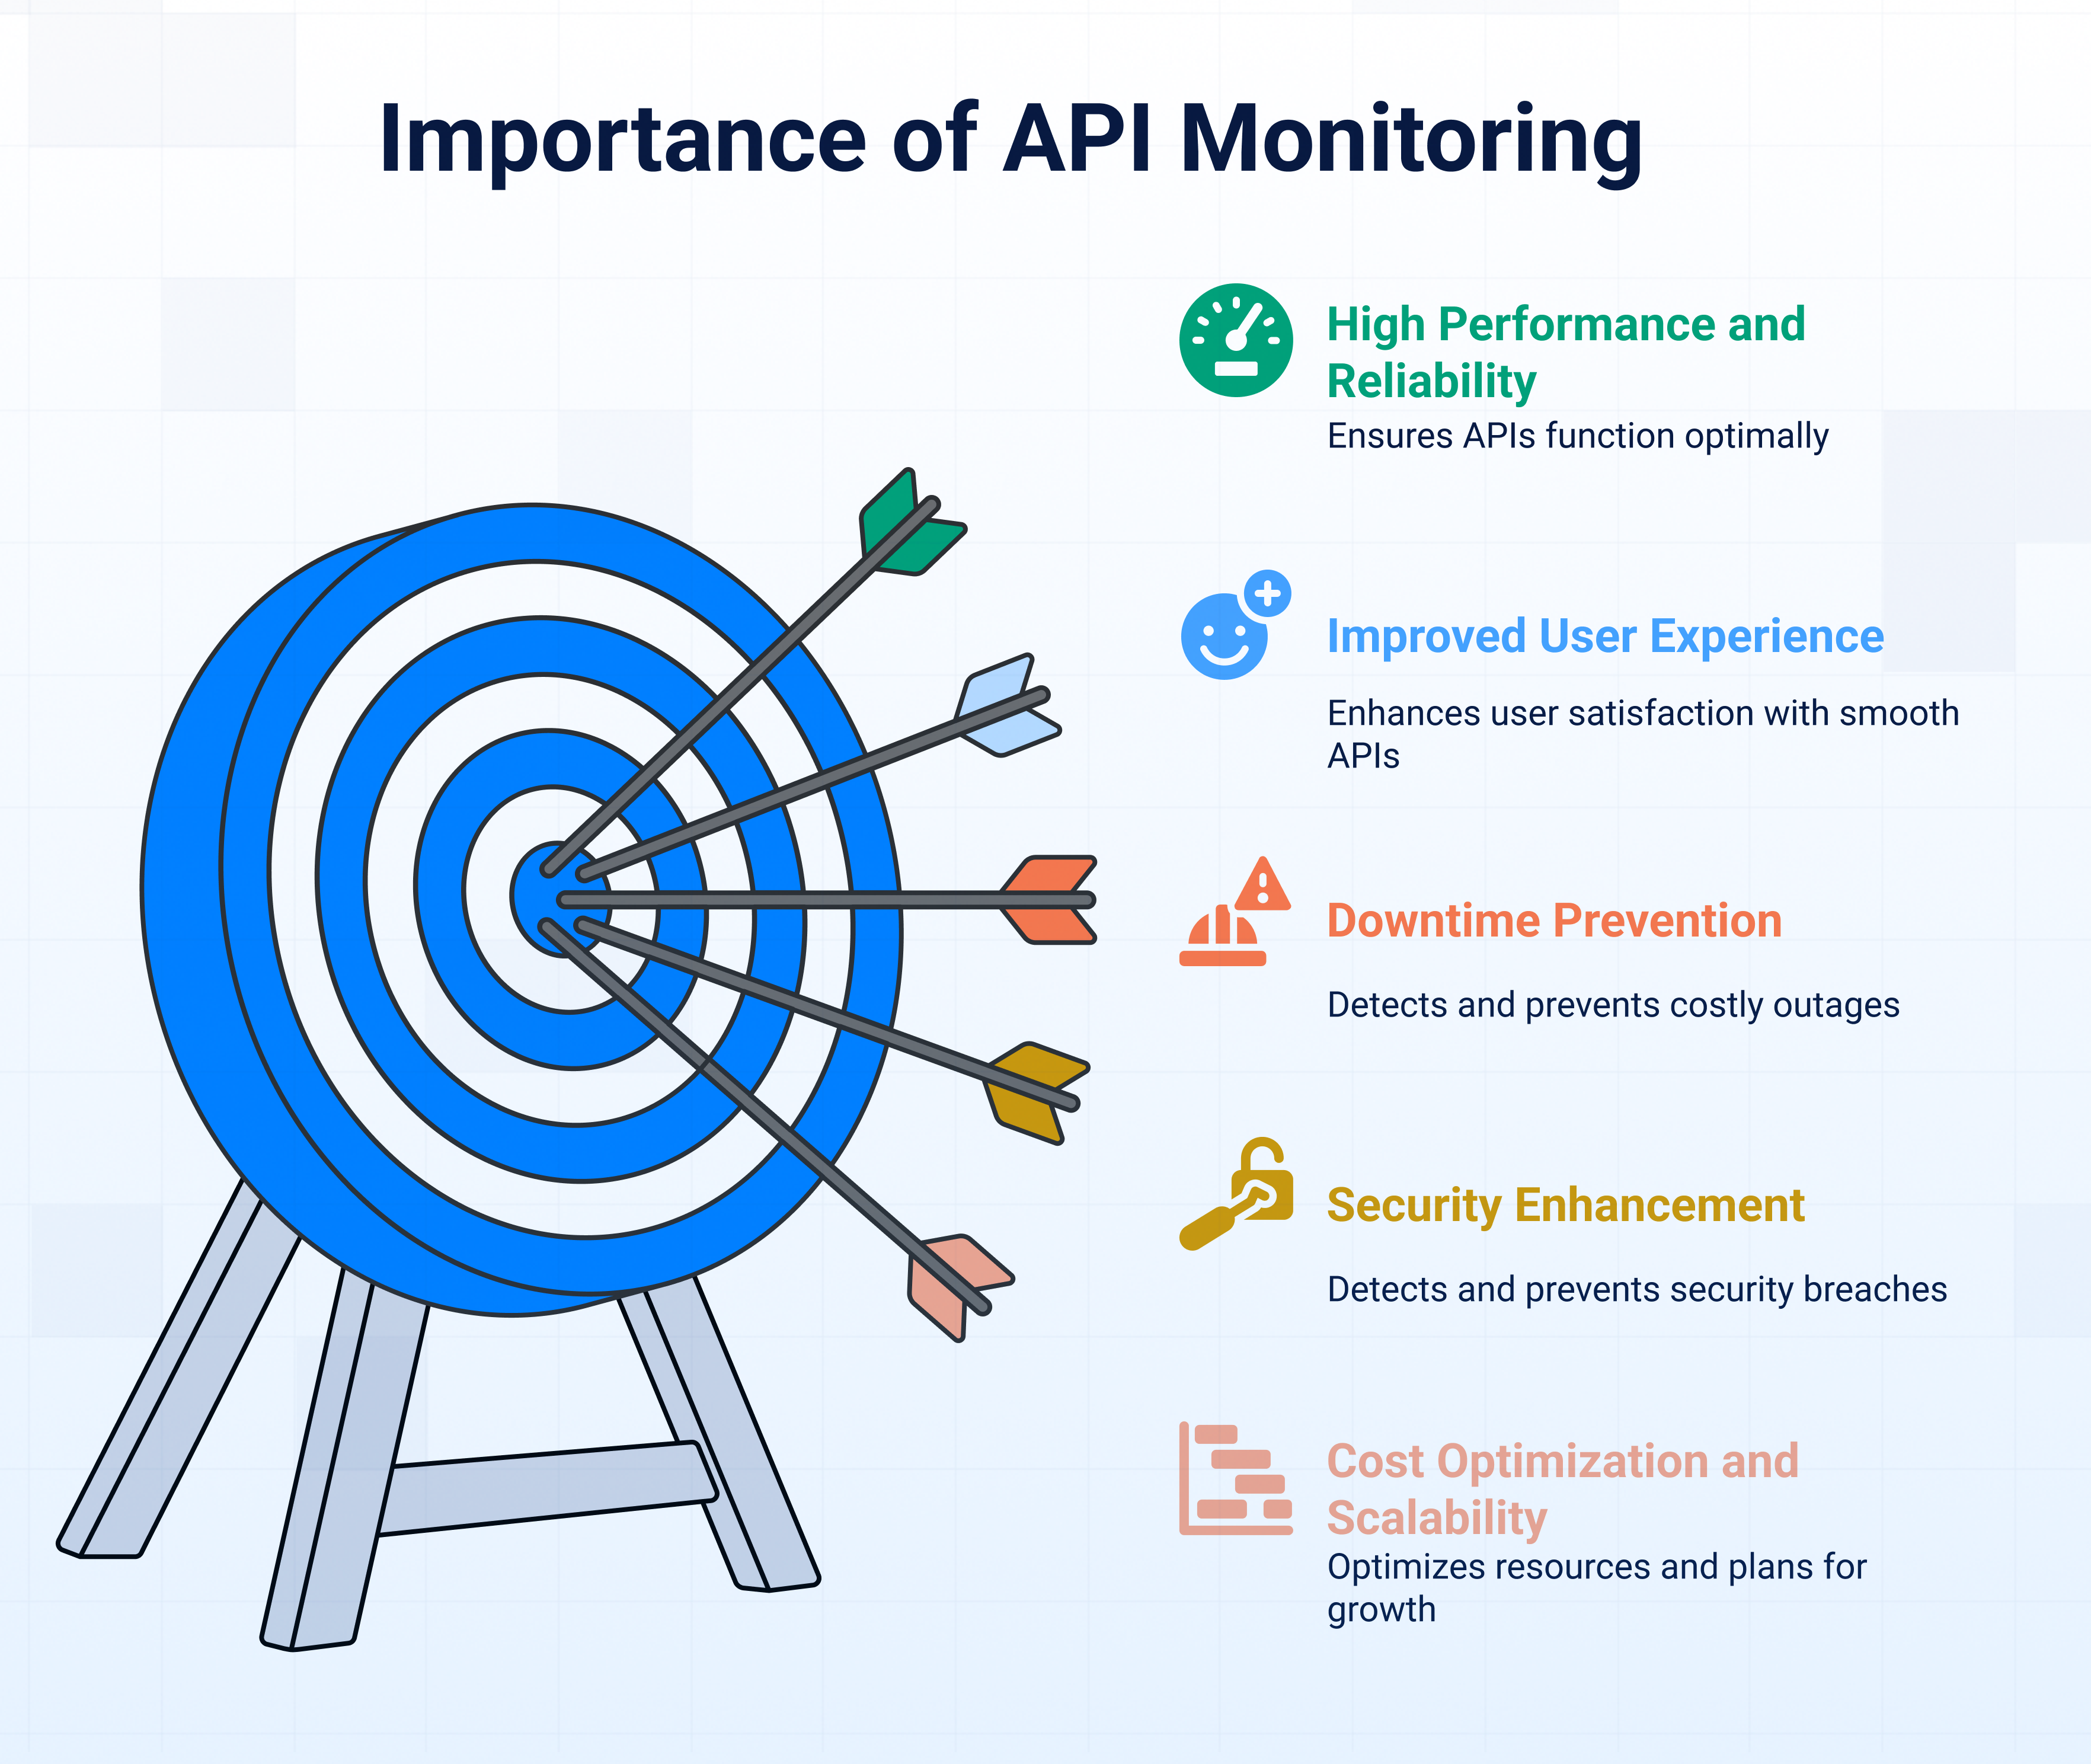
APIs, or application programming interfaces, are the backbone of modern digital ecosystems, enabling seamless communication between applications, services, and users. But just like any critical system, they need constant tracking to ensure they perform optimally. That’s where API metrics come in. They provide real-time insights into how your APIs are functioning, helping you detect issues before they escalate. Here is why monitoring API management metrics and API performance metrics is crucial:
1. Ensures high performance and reliability
Nobody likes slow or crashing apps. If your API takes too long to respond or fails frequently, users will abandon your service. By tracking API performance metrics like response time, error rates, and uptime, you can identify bottlenecks, whether it's server overload, inefficient code, or third-party dependencies.
For example, if your payment gateway API starts lagging during peak hours, real-time monitoring helps you scale resources before customers experience delays.
2. Improves user experience
A smooth API means a smooth experience for end-users. Metrics like latency, throughput, and success rates directly impact how fast and reliably your app functions.
If an e-commerce API slows down during checkout, customers might abandon their carts. Monitoring helps you maintain consistency, keeping users happy and engaged.
3. Detects and prevents downtime
Downtime is costly, both financially and reputational. Major outages can lead to lost revenue and frustrated customers.
By keeping an eye on API management metrics such as availability and error rates, you can catch anomalies early. API management platforms with automated alerts can notify your team the moment an API starts failing, allowing for quick fixes before users even notice.
4. Enhances security and threat detection
APIs are prime targets for cyberattacks. For instance, in November 2022, hackers exploited T-Mobile’s API vulnerability and stole personal information from their 37 million postpaid and prepaid customer accounts.
Suspicious spikes in traffic, unusual request patterns, or unauthorized access attempts can signal security breaches. Monitoring metrics like authentication failures, IP throttling, and abnormal traffic helps detect threats early.
For example, if an API suddenly receives thousands of login attempts from a single IP, it could be a brute-force attack. Real-time monitoring allows you to block malicious traffic before damage occurs.
5. Optimizes costs and resource allocation
Not all API calls are created equal. Some consume more bandwidth or server resources than others. By analyzing API performance metrics such as request volume, data transfer size, and CPU usage, you can optimize resource allocation.
For example, if a rarely used API endpoint is consuming excessive server power, you might refactor it or implement caching to reduce costs. Monitoring helps you avoid over-provisioning or unnecessary scaling expenses.
6. Supports scalability planning
As your user base grows, so does API traffic. Without proper monitoring, sudden surges can overwhelm your infrastructure. Tracking metrics like request rates, concurrent connections, and peak usage times helps you anticipate scaling needs.
If your API analytics dashboard shows a steady increase in API calls, you can proactively upgrade servers or implement load balancing to handle future demand smoothly.
7. Provides data-driven insights for business decisions
API metrics aren’t just for tech teams; they offer valuable business insights.
For example:
- High traffic on a specific API could indicate a popular feature worth investing in.
- Frequent errors in a partner API might suggest switching vendors.
- Slow response times in certain regions may reveal the need for localized servers.
By analyzing trends in API management metrics, you can make informed decisions that enhance both technical performance and customer satisfaction.
Ignoring API metrics is like driving blindfolded—you won’t see problems until it’s too late. Whether it’s improving speed, preventing outages, tightening security, or cutting costs, monitoring API performance metrics is non-negotiable for any modern digital service.
The best part? With today’s advanced monitoring tools like DigitalAPI, keeping tabs on your APIs is easier than ever.
Key API metrics to monitor
When you're managing APIs, tracking the right metrics can make all the difference between delivering a smooth, fast experience or letting users down. With APIs powering everything from mobile apps to complex enterprise systems, monitoring how they behave is essential.
So, what API metrics should you be keeping a close eye on?
Below, we’ll explore the most critical API performance monitoring metrics you shouldn’t ignore.
We grouped them into three major areas: application-level, infrastructure-level, and business-level insights like adoption and security.
1. Application-level API metrics
Application-specific metrics help you understand how your APIs are performing in the context of your app. They provide a zoomed-in view of how well requests are handled, how users interact with the API, and where potential performance issues might lie.
They include:
Requests Per Minute (RPM)
This is one of the foundational API metrics. This measures how many requests hit your API every minute. It’s an essential measure of traffic volume. Tracking RPM gives you a sense of how busy your API is.
Spikes could indicate legitimate growth, or they might signal abuse or a DDoS attack. A sudden drop? That could mean downtime or broken client apps. Monitoring RPM helps you scale infrastructure, allocate resources, and detect unusual activity early as well.
Latency
Latency refers to the time it takes for a request to travel from the client to the API server and back again. It’s usually measured in milliseconds (ms).
Latency is one of the most important API performance monitoring metrics. Even if your API is available and working, high latency can ruin the user experience.
Let’s say your endpoint takes 800ms to respond instead of 80ms, That’s a noticeable delay. And on modern, fast-loading apps, that kind of sluggishness can drive users away.
Things that affect latency include network hops, server processing speed, database performance, and even geographic location. Tracking average, median, and percentile latencies helps pinpoint where slowdowns are happening.
Failure rate
No system is perfect. That’s why failure rate—how often requests fail is a must-watch metric.
Failures can be due to timeouts, bad gateway errors (502), service unavailable (503), or internal server errors (500). External APIs can also fail on their own. Knowing how often and why these failures occur helps you take preventative action.
For instance, a rising failure rate might indicate overloaded infrastructure, expired authentication tokens, or faulty deployments. This metric supports decisions like setting up retries, fallback mechanisms, or switching to more reliable third-party services.
Time to First Hello World (TTFHW)
Here’s a unique one: Time to First Hello World (TTFHW) measures how long it takes a new user to successfully interact with your API after signing up or landing on your developer portal.
A low TTFHW means your API is easy to use and onboard with. High TTFHW? It could mean your documentation is confusing, authentication is complex, or your API lacks sandbox/testing environments. Measuring TTFHW is a great way to improve API adoption metrics and developer satisfaction.
2. Infrastructure-level API metrics
The backend that supports your API plays a massive role in overall performance. These API management metrics dig into how well your infrastructure is holding up under the hood.
They include:
API uptime
Uptime is the percentage of time your API is available and operational. It’s often calculated over days, weeks, or months.
Even short downtimes can result in huge revenue losses or angry customers. Most teams aim for at least 99.9% uptime (a.k.a. “three nines”). If your uptime dips below that, it’s time to examine error logs, server health, or network connectivity. API uptime monitoring ensures your system meets SLA (Service Level Agreement) commitments and builds trust with users.
Uptime checks should also include status code validation. Just because an endpoint responds doesn’t mean it’s healthy—returning 500 errors still counts as downtime in many contexts.
CPU and memory usage
Behind the scenes, every API call uses server resources. That’s where CPU and memory usage comes in.
If your CPU usage is constantly peaking, your servers are likely overloaded. That can lead to timeouts, increased latency, and failed requests. On the flip side, low CPU/memory usage might indicate over-provisioning—meaning you’re paying for unused resources.
Monitoring these metrics gives you insight into whether to scale up or down. It also helps in pinpointing performance bottlenecks caused by heavy computation, inefficient code, or database queries.
3. API security and adoption metrics
Monitoring the health and performance of your APIs is great, but you also need to ensure they’re secure and delivering business value. These metrics help you zoom out and measure long-term success.
API security metrics
When it comes to APIs, security is not optional. Here are a few critical API security metrics you should be watching:
- Unauthorised access attempts: Are attackers trying to brute-force your endpoints?
- Rate limit violations: Are users abusing your service or exceeding fair use?
- Token expiry and refresh rates: Are your authentication flows working correctly?
APIs are prime targets for attacks such as data leaks, injection attacks, or account takeovers. Good API management metrics include monitoring access patterns, tracking unusual behavior, and logging invalid authentication attempts. Combine these with real-time alerts to catch threats before they escalate.
Security metrics not only protect your system but also ensure compliance with industry standards like GDPR, HIPAA, or PCI-DSS, depending on your industry.
API adoption metrics
Finally, let’s talk business. API adoption metrics show how your API is being used and whether it’s adding value.
Some key metrics to track:
- Active developers: How many developers are regularly using your API?
- New signups: Are more people onboarding to your platform?
- Endpoint usage: Which parts of your API are used most often?
These numbers tell a bigger story—whether your API is gaining traction; if users find it helpful, and how you can improve it. If certain endpoints are underused, maybe they need better documentation or don't solve a real problem.
High adoption, on the other hand, can justify investing more in product development or scaling infrastructure.
When it comes to API performance monitoring metrics, no single stat tells the whole story. You need a complete picture—from how fast your API responds, to how often it fails, to whether it's even being used. That means tracking metrics across the three main dimensions above.
With the right API management metrics, you’ll catch problems early, boost performance, improve developer experience, and grow adoption. Consider using monitoring tools like Digital API, Postman, Datadog, New Relic, or Prometheus to automate this tracking and get real-time insights.
Best Practices for Monitoring API Metrics
When it comes to keeping your APIs healthy, fast, and reliable, monitoring is essential. Whether you're managing internal APIs for your dev teams or public-facing APIs used by thousands of customers, how well (or poorly) your APIs perform directly impacts user experience, system reliability, and even business revenue.
But with dozens of different metrics to choose from and a sea of tools out there, how do you know what to focus on?
Let’s cut through the noise. Here are eight API monitoring best practices you should adopt if you want to stay on top of your API performance monitoring metrics, avoid outages, and optimize your API management metrics for success.
1. Track the right API metrics (not all of them)
It’s tempting to measure everything, but too much data becomes noise. Start by identifying key API metrics that reflect performance, availability, and reliability.
Here are a few must-haves:
- Latency/Response time – How fast your API responds to requests.
- Error rates – Frequency of 4xx and 5xx status codes.
- Throughput – Number of API calls per minute/hour.
- Uptime/Downtime – Availability of your API services.
- CPU and memory usage (for backend services).
These API performance monitoring metrics will give you a clear picture of how your APIs are behaving. Custom metrics, like conversion success rates or payment transaction completion rates, can be layered in depending on your business.
2. Set thresholds and alerts (but don’t overdo it)
Imagine your API latency spikes in the middle of the night. Would you even know?
That’s why setting intelligent thresholds and alerts is one of the most underrated API monitoring best practices.
Here’s how to do it well:
- Use dynamic thresholds based on baselines, not just fixed numbers.
- Avoid alert fatigue by limiting alerts to what’s actionable.
- Create escalation paths (e.g., send a Slack message for minor issues, but trigger PagerDuty for critical ones).
This helps your team respond faster while staying sane.
3. Monitor both external and internal APIs
Many teams focus only on external APIs consumed by clients or customers while forgetting internal APIs. They’re often just as critical.
Internal microservices that talk to each other behind the scenes can be the root cause of API issues. By monitoring both ends; consumer-facing APIs and backend/internal APIs, you get full visibility into the entire data flow and can troubleshoot faster.
Note that internal API downtime can bring your whole system down. Treat them with the same level of importance.
4. Segment API monitoring by endpoint and region
Not all parts of your API behave the same. A login endpoint will behave differently from a data upload or a reporting endpoint. Similarly, users in the U.S. may experience faster response times than users in Asia.
So instead of just looking at aggregate numbers, break down your API metrics by:
- Endpoint (e.g., /login, /checkout, /report)
- Region or data center
- Customer segment or API key
This granularity helps you spot where the issues are happening, not just that they’re happening.
5. Correlate API metrics with business KPIs
This is where things get really smart. It’s one thing to know your error rate spiked. It’s another to know that the spike caused a 12% drop in completed purchases.
Start mapping API management metrics to real business outcomes:
- Cart abandonment vs. latency during checkout
- Drop in revenue correlated with API errors
- Onboarding rate tied to API success on signup
By doing this, your API monitoring becomes a business tool not just a dev tool. You’ll make better decisions, and leadership will love the visibility.
6. Automate with synthetic monitoring and real-user metrics
Don’t wait for users to report an issue. Use synthetic monitoring to simulate API calls from different locations and measure performance before your users hit problems.
Combine that with real-user monitoring (RUM) data to see how your APIs perform under actual traffic. The two complement each other:
- Synthetic = proactive alerts, consistency across regions
- RUM = actual behavior, real-world conditions, user impact
Together, they give you full-stack visibility—from test simulations to real-world usage.
7. Review and iterate
Finally, API monitoring isn’t a “set it up once and walk away” kind of thing. Your systems evolve. New endpoints get added. User behavior changes. What worked last year might be outdated today.
Here’s how to stay agile:
- Review dashboards monthly. Are you tracking what still matters?
- Audit alerts. Are they still relevant? Are any being ignored?
- Gather feedback. What are developers and support teams seeing that metrics aren’t showing?
Keep evolving your API monitoring best practices to stay ahead of performance issues and improve over time.
8. Select an API management tool that has a strong alerting functionality
You can’t fix what you don’t know is broken. That’s why choosing an API management tool with strong alerting functionality is critical for modern teams.
A great alerting system doesn’t just scream when something breaks. It tells the right people, in the right way, with the right context.
Here’s what to look for in a solid alerting setup:
- Custom thresholds based on your specific API metrics
- Smart routing of alerts through tools like Slack, PagerDuty, Microsoft Teams, or email
- Support for anomaly detection so you get notified before major failures
- Integrated incident workflows, so your team can jump from alert to resolution fast
The best API management tools combine real-time API performance monitoring metrics with built-in alert logic that helps your team act, not just react.
Common Challenges in Monitoring API Metrics
Monitoring API metrics may sound like a straightforward task. Just track some numbers, set a few alerts, and call it a day, right? Not quite. In reality, keeping tabs on API performance is far more complicated, especially as systems grow more distributed, user demands increase, and organizations rely more heavily on third-party services.
Let’s unpack some of the most common challenges teams face when it comes to API performance monitoring metrics.
Scope and complexity of the API ecosystem
Modern applications are made up of internal APIs, external APIs, micro services, third-party dependencies, and cloud-based services. Each of these layers introduces unique challenges when trying to monitor API management metrics effectively.
Let’s explore them in detail.
- Internal vs. external APIs: While internal APIs might impact backend processes, external APIs directly influence user experience. Monitoring both is essential, but external APIs often need more real-time scrutiny because a single hiccup can mean broken functionality for end-users.
- Distributed systems & microservices: APIs today are part of sprawling systems that span across data centers, cloud providers, and services. That means when something goes wrong, like increased latency, it’s not always clear which piece of the puzzle is causing the issue.
- Third-Party Dependencies: One of the most frustrating aspects of API performance monitoring is when an API relies on services outside your control. A slowdown in a third-party payment gateway, for example, could cascade down and affect your own API’s performance—even if everything on your end is working fine.
Root cause identification is tricky
Even when an issue is detected, understanding why it’s happening isn’t always easy.
- Latency and bottlenecks: High response times might stem from overloaded servers, inefficient database queries, or even poor code optimization. Without proper visibility into all layers, you’re left guessing.
- Scaling problems: As traffic surges, especially during product launches or seasonal peaks, some APIs can’t keep up. If your monitoring doesn’t include predictive scaling indicators, you could find out too late.
- Error handling complexity: APIs often fail silently or return ambiguous error messages. Without robust error logging and analysis, diagnosing these failures becomes an uphill battle.
Challenges with data collection and interpretation
Monitoring isn’t just about collecting data. It’s about understanding it. And that’s where many teams struggle. Here is where it gets tough for teams:
- Massive data volume: APIs generate a firehose of logs and metrics. Sifting through this data to find meaningful trends or pinpoint anomalies can be overwhelming, especially without automated tools.
- Real-world scenarios don’t always match tests: Metrics in a staging environment might look great, but things can change drastically once the API is exposed to real users with varied devices, locations, and network speeds.
- Context is everything: A spike in latency might not be a red flag unless you understand what else is happening, like a large file upload or a user from a high-latency region. API management metrics are only as useful as the context they provide.
- Log analysis can be a time sink: Digging into logs manually requires time and expertise. Without structured logging and good visualization tools, your team might spend more time analyzing than resolving.
Tooling, integration, and security hurdles
Even with the right intent, setting up an effective API metrics monitoring system isn’t as simple as downloading a dashboard.
- Choosing the right tool: The market is flooded with monitoring tools. Some excel at tracking uptime, while others focus on error rates or traffic patterns. Picking the wrong one can leave critical blind spots in your monitoring setup.
Digital API offers powerful API analytics that offers real-time insights, usage tracking, and performance optimization. With intuitive dashboards and deep analytics, it enables proactive issue detection and smarter decision-making.
- Integration challenges: Adding new monitoring tools to an existing infrastructure isn’t always seamless. Legacy systems, data silos, and inconsistent data formats can get in the way.
- Alert fatigue and misconfigured notifications: If your team gets flooded with alerts—especially false positives they may start ignoring them. On the flip side, missing a critical alert because of poor configuration can lead to major outages.
- Security and compliance: Monitoring tools often have access to sensitive data. Ensuring this data is encrypted, stored securely, and accessed only by authorized personnel is a non-negotiable part of the process.
Use Digital API to Effectively Monitor API Metrics
.png)
Tracking key API metrics is essential, but without the right tool, it can quickly become overwhelming. Downtime, latency, traffic spikes, and error rates are all critical indicators that directly affect API performance and user experience. This is where Digital API proves invaluable.
Digital API is a unified, AI-powered platform designed to simplify API management and monitoring. Its powerful API Analytics feature gives you real-time visibility into performance, consumption trends, and error patterns.
With actionable insights and predictive alerts, you can detect bottlenecks early, optimise usage, and ensure reliable uptime.
The tool helps you catch issues before they escalate, keeping your APIs fast, secure, and dependable.
Request a free demo today to see how Digital API can accelerate your API monitoring game and adoption.
Frequently asked questions (FAQs)
1. How do I monitor API latency, error rates, and throughput?
Monitor API latency, error rates, and throughput by using API management platforms or APM tools like Datadog, New Relic, or Prometheus. Set up dashboards to track response times, error codes, and request volumes in real time. Use alerts to detect anomalies and ensure performance.
2. Which API metrics help detect performance bottlenecks?
API metrics that help detect performance bottlenecks include latency, error rate, request per second (RPS), CPU and memory usage, and timeouts. High latency and error spikes often signal backend issues, while low throughput or high resource usage reveals scaling or infrastructure limits.
3. How can I track API adoption and retention over time?
Track API adoption and retention over time by measuring unique developers, active API keys, and request frequency. Monitor usage trends across time periods, onboarding rates, and repeat access. Use analytics platforms to segment users, visualize engagement, and identify long-term usage patterns.
4. What are key API metrics for a public developer platform?
Key API metrics for a public developer platform include request volume, latency, error rate, API key activations, developer sign-ups, retention rate, and usage by endpoint. These metrics reveal engagement, performance, and reliability, helping teams optimize the developer experience and platform scalability.
5. Can API metrics help detect abuse or suspicious activity?
API metrics can help detect abuse or suspicious activity by monitoring sudden spikes in traffic, unusual error patterns, rate limit violations, and unauthorized access attempts. Anomalies in usage trends or geographic data often indicate bot activity, credential stuffing, or misuse of API resources.

.svg)
.avif)