
Best API Monitoring Tools: Choose Your Perfect Solution in 2026
API monitoring involves systematically tracking the availability, performance, and correctness of your APIs.

TL;DR
1. APIs are the backbone of modern digital services, and their uninterrupted performance is critical for business operations and user satisfaction.
2. API monitoring tools are essential for tracking availability, performance, and functionality, proactively identifying issues before they impact end-users.
3. These tools offer various capabilities, from simple uptime checks and synthetic transaction monitoring to comprehensive full-stack observability and AI-driven insights.
4. Key features to consider include global monitoring locations, detailed diagnostics, alert mechanisms, and integration with incident management systems.
5. Choosing the right API monitoring solution depends on your organization's complexity, budget, existing tech stack, and specific needs for real-time visibility and issue resolution.
APIs are the sinews connecting today's digital services, quietly powering everything from mobile apps to critical business workflows. When an API falters, the ripple effect can be immediate and severe, impacting user experience, revenue, and brand trust. Ensuring these vital connections remain robust and responsive isn't just a best practice; it's a fundamental requirement for operational health. This makes API monitoring indispensable, acting as the vigilant guardian of your digital infrastructure. Dive into this guide to explore the leading API monitoring tools, helping you pinpoint the ideal solution to keep your APIs and your business performing flawlessly.
What is API Monitoring and Why is it Crucial?
API monitoring involves systematically tracking the availability, performance, and correctness of your APIs. It's about knowing if your APIs are up, responding quickly, and returning the expected data. This crucial practice goes beyond simple uptime checks, delving into latency, error rates, and functional validation. By continuously observing API behavior from various locations and under different conditions, organizations can proactively identify issues before they impact end-users or dependent systems. Effective API monitoring provides the insights needed to maintain reliability, optimize performance, and ensure the seamless operation of interconnected digital services.
Top 10 API Monitoring Tools: Choose Your Perfect Solution
Exploring the landscape of API monitoring solutions reveals a diverse range of tools, each offering unique strengths tailored to different organizational needs and technical complexities. From dedicated synthetic monitoring platforms to comprehensive full-stack observability suites, the right choice empowers teams to maintain high availability, optimize performance, and ensure the integrity of their API-driven applications. Here’s a breakdown of the top 10 API monitoring tools, detailing their core features, advantages, drawbacks, and ideal use cases.
1. DigitalAPI (Unified API Intelligence & Observability)
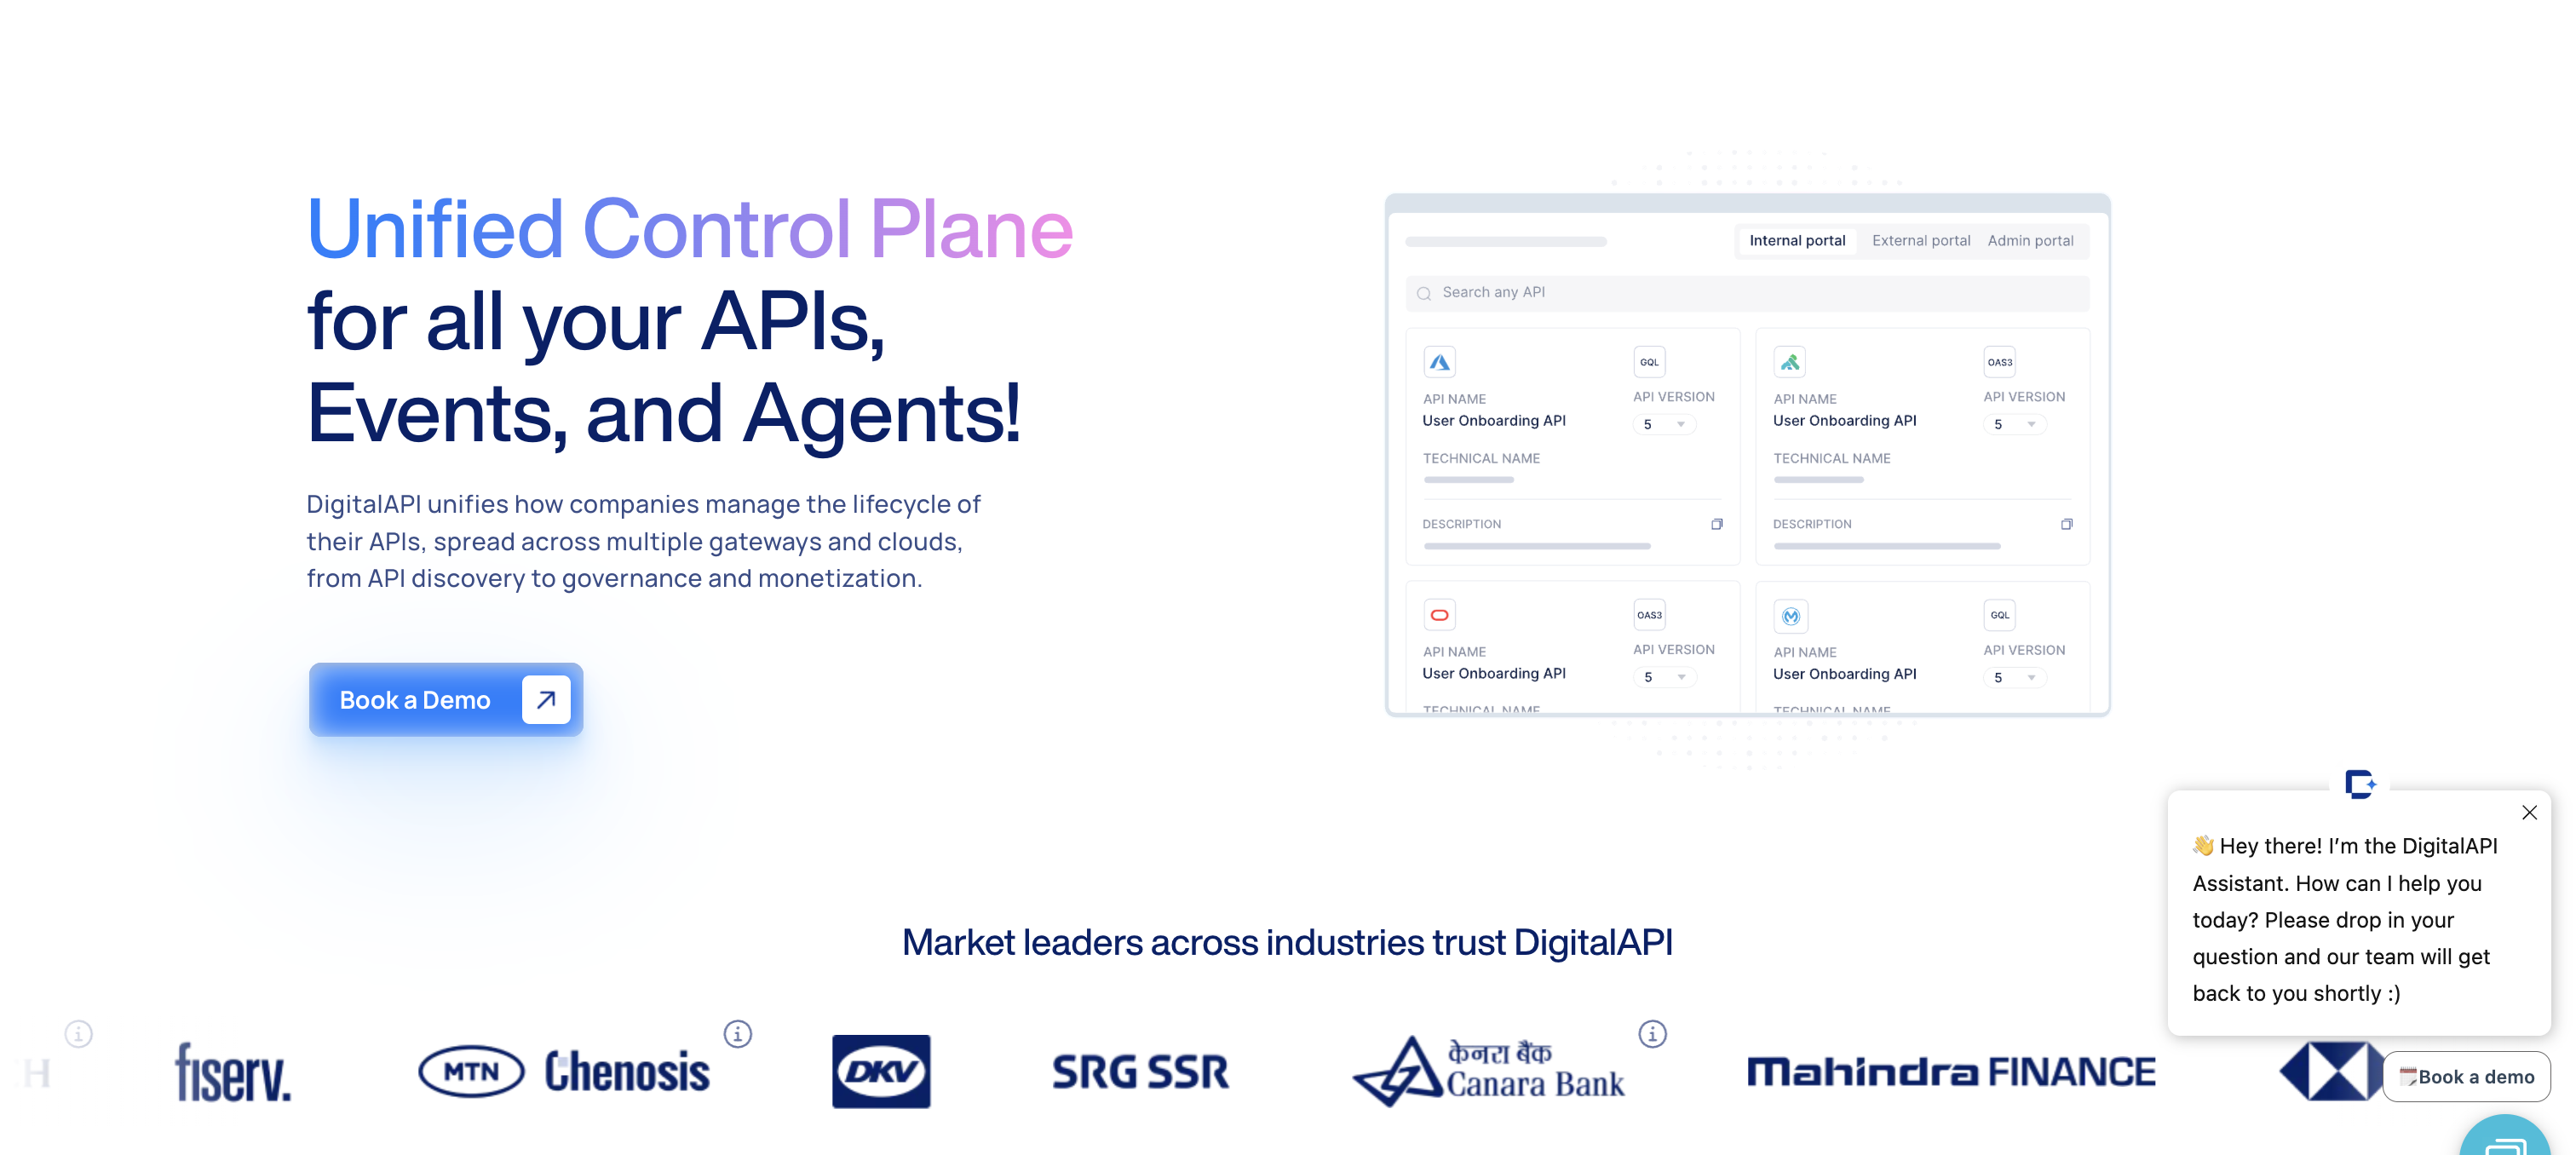
DigitalAPI provides a unified intelligence and analytics layer across your entire API estate, helping enterprises understand what APIs exist, how they’re performing, who’s using them, and where value is being created, across multiple gateways, clouds, and consumers.
Key Features
- Unified API discovery across gateways: Automatically discovers APIs across Apigee, Kong, AWS API Gateway, MuleSoft, and more in a single searchable catalog.
- Centralised API analytics: Consolidates traffic, latency, errors, and usage metrics across all gateways into one view.
- Cross-gateway governance & policy visibility: Define and enforce consistent governance rules without re-platforming or rewriting APIs.
- API adoption & consumption insights: Track which APIs are used, by whom, how often, and for what purpose (internal, partner, or AI agents).
- Developer & partner experience layer: Self-serve portals, sandboxes, and documentation that sit above existing gateways.
- Gateway-agnostic architecture: Works with your existing gateways, no rip-and-replace required.
Pros
- Goes beyond uptime to show API value, ownership, and adoption
- Eliminates blind spots caused by multi-gateway sprawl
- Prepares APIs for AI agents and automated consumers, not just humans
Cons
- Not designed for basic “ping-only” uptime checks
- Requires connectivity with existing gateways for full visibility
Ideal For
Enterprises running multiple API gateways that need a single source of truth for API discovery, governance, analytics, and readiness for developers, partners, and AI agents, without replacing their existing infrastructure.

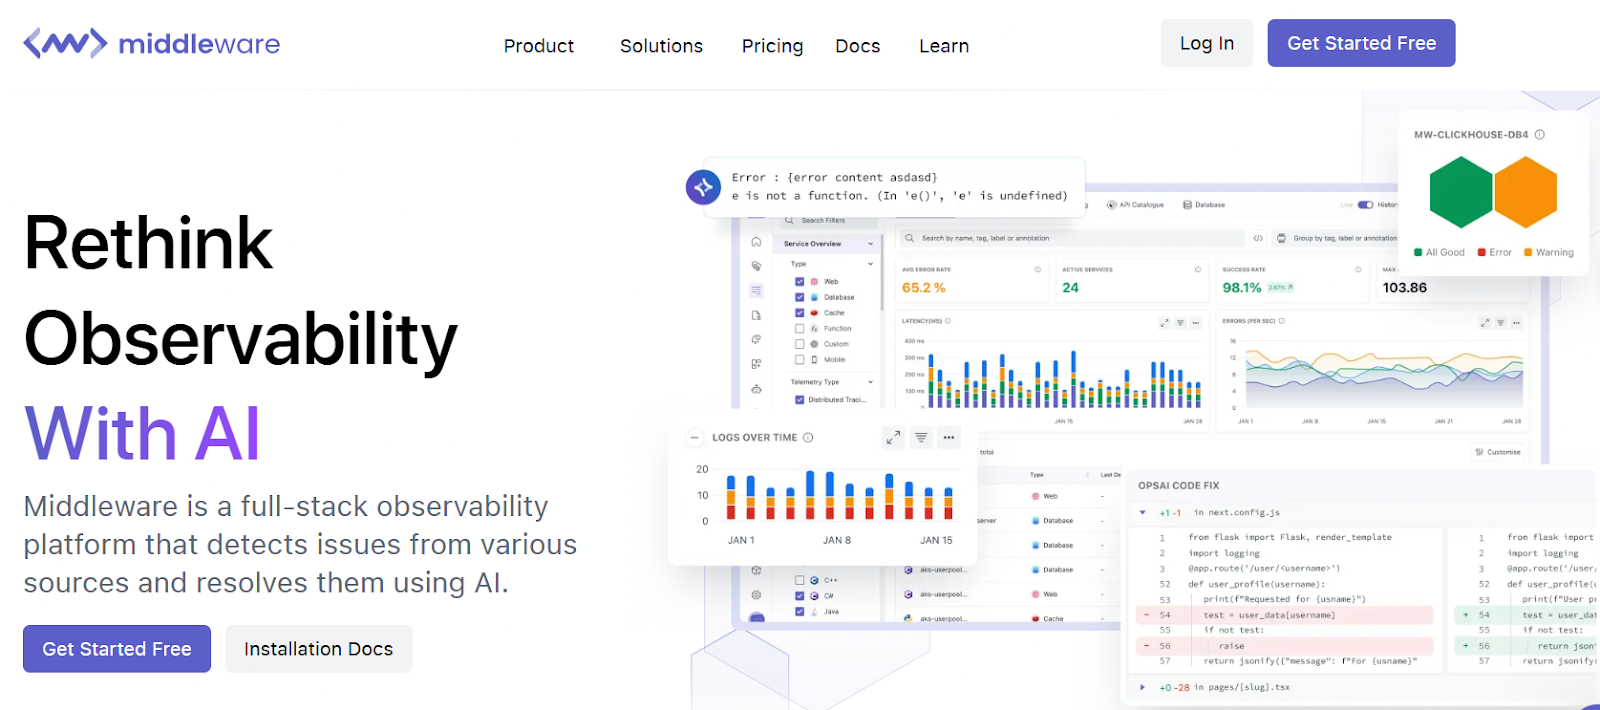
2. Middleware
Middleware is a full-stack observability platform that unifies logs, metrics, and traces in a single place, enabling faster troubleshooting and improved system visibility. It offers real-time log monitoring, AI-powered issue detection with OpsAI, and seamless correlation across telemetry data. Designed for cloud-native environments, Middleware helps teams monitor, analyze, and resolve performance issues efficiently.
Key Features
- API performance monitoring: Track API response times, errors, and availability in real time.
- Full MELT observability: Monitor metrics, events, logs, and traces in one unified platform.
- Real-time log monitoring: Centralized log collection with fast search and analysis.
- Distributed tracing: End-to-end visibility across applications and microservices.
- OpsAI-powered RCA: AI-driven issue detection with automated root cause analysis.
Pros:
- Strong visibility into API performance with unified telemetry.
- Unified observability platform covering logs, metrics, and traces.
- AI-powered insights help reduce troubleshooting time.
- Easy setup with support for cloud-native environments.
Cons:
- Relatively newer compared to established observability tools.
- Advanced enterprise-level features may still be evolving.
Ideal For: Teams that need unified API monitoring with deep visibility into performance, errors, and dependencies across modern cloud-native applications.
3. Postman
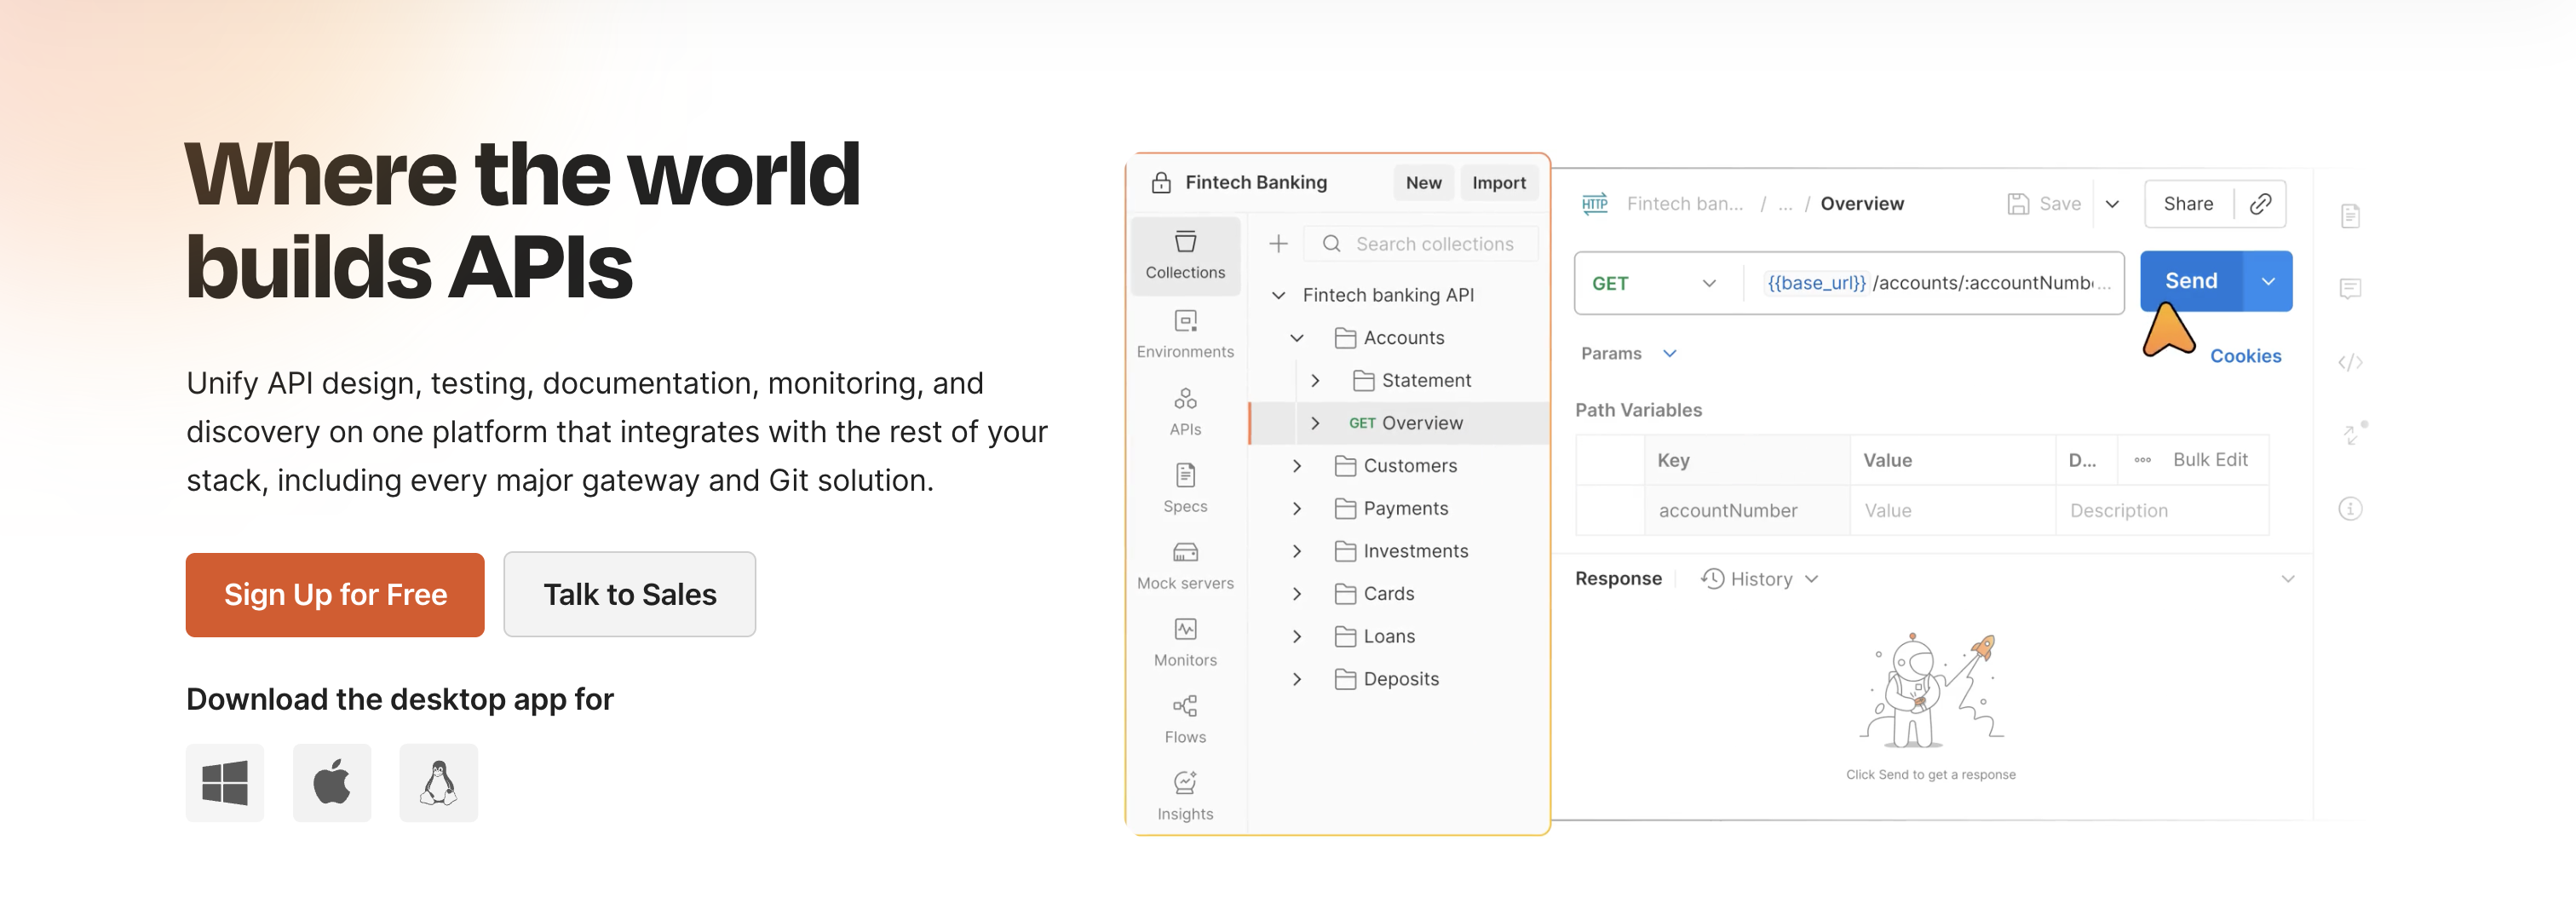
Postman is widely known for API development and testing, but it also offers a robust monitoring solution. It allows users to schedule collections of API requests to run at specified intervals from various global regions. This helps ensure that APIs are not only functional but also performing optimally and returning correct data from an end-user perspective, detecting issues like latency or incorrect responses.
Key Features
- Scheduled synthetic API checks: Run Postman collections at defined intervals to validate API uptime and responses.
- Global monitoring locations: Execute monitors from multiple regions to catch latency and regional failures.
- Assertions & validations: Validate response status codes, schemas, headers, and business logic.
- Workspace-native monitoring: Uses existing Postman collections without duplicating configs.
- Alerting & notifications: Get notified via email, Slack, or integrations when monitors fail.
Pros:
- Seamless integration with Postman workspaces and existing collections.
- Monitors API functionality, performance, and response correctness.
- Global monitoring locations for real-world performance insights.
Cons:
- Primarily focused on synthetic monitoring, less on deep APM.
- Advanced analytics and reporting might require other tools.
- Can become costly for a large number of monitors and requests.
Ideal For:
Development teams already using Postman for API testing and collaboration, needing integrated synthetic monitoring directly within their workflow.
4. SmartBear
AlertSite is a comprehensive synthetic monitoring platform from SmartBear, specifically designed for APIs, web, and mobile applications. It offers monitoring from over 300 global locations, providing detailed performance metrics, uptime, and error reporting. Users can create complex API transaction monitors to ensure multi-step API workflows function as expected, crucial for critical business processes.
Key Features
- 300+ global monitoring nodes: Monitor API performance from real-world locations worldwide.
- Multi-step API transaction monitoring: Validate complex workflows across chained API calls.
- Advanced performance metrics: Track latency, availability, and error rates per region.
- Root cause diagnostics: Detailed failure insights including network, DNS, and server issues.
- SLA & uptime reporting: Built-in reporting for compliance and reliability tracking.
Pros:
- Extensive global monitoring network for accurate regional performance.
- Supports complex multi-step API transaction monitoring.
- Deep diagnostics and root cause analysis for quick issue resolution.
Cons:
- Can be more expensive than simpler uptime monitoring solutions.
- Primarily synthetic monitoring, less focus on real-user monitoring.
- Initial setup for complex transactions might have a learning curve.
Ideal For:
Enterprises requiring robust, global synthetic monitoring for mission-critical APIs and multi-step API workflows, ensuring external-facing service reliability.
5. APImetrics
APImetrics is a specialized API monitoring platform that uses AI and machine learning to provide advanced insights into API performance and quality. It goes beyond basic uptime to measure API quality scores, predict outages, and identify performance degradation trends. By analyzing vast amounts of API call data, APImetrics helps businesses understand the true end-to-end user experience across various networks and cloud providers.
Key Features
- API Quality Scoring: Measures APIs against availability, performance, and reliability benchmarks.
- AI-driven anomaly detection: Identifies degradation patterns and predicts potential outages.
- End-to-end user experience simulation: Tests APIs across networks, clouds, and geographies.
- Trend & degradation analysis: Detects slow performance changes before they impact users.
- SLA & compliance monitoring: Tracks external and partner API reliability over time.
Pros:
- AI-driven insights and predictive analytics for proactive issue detection.
- Measures API quality scores and benchmarks against industry standards.
- Monitors APIs from diverse global locations, simulating real user conditions.
Cons:
- Can be an overkill for simpler API monitoring needs.
- Might have a steeper learning curve due to advanced features.
- Pricing scales with the complexity and volume of monitoring required.
Ideal For:
Businesses heavily reliant on external or partner APIs, or those requiring deep, AI-powered insights into API quality, performance, and SLA compliance.
6. UptimeRobot

UptimeRobot is a popular, user-friendly, and cost-effective monitoring service primarily known for its website and API uptime checks. It monitors HTTP(S) endpoints, ports, pings, and keywords, alerting users instantly via various channels if an issue is detected. While straightforward, it provides essential availability metrics and basic response time data, making it an excellent starting point for many organizations.
Key Features
- Simple uptime monitoring: Monitors HTTP(S), ports, ping, and basic API endpoints.
- Fast check intervals: As frequent as every 60 seconds.
- Instant alerts: Notifications via email, SMS, push, webhook, and integrations.
- Status pages: Public or private status pages for transparency.
- Free & affordable plans: Suitable for budget-conscious teams.
Pros:
- Extremely easy to set up and use, even for non-technical users.
- Affordable pricing, with a generous free tier available.
- Offers multiple alert types (email, SMS, push, webhook) and integrations.
Cons:
- Limited advanced monitoring features compared to full APM tools.
- Basic reporting and analytics capabilities.
- Lacks deep transaction monitoring or performance profiling.
Ideal For:
Small to medium businesses, startups, or individuals needing simple, reliable, and affordable API uptime monitoring with instant alerts.
7. BetterStack
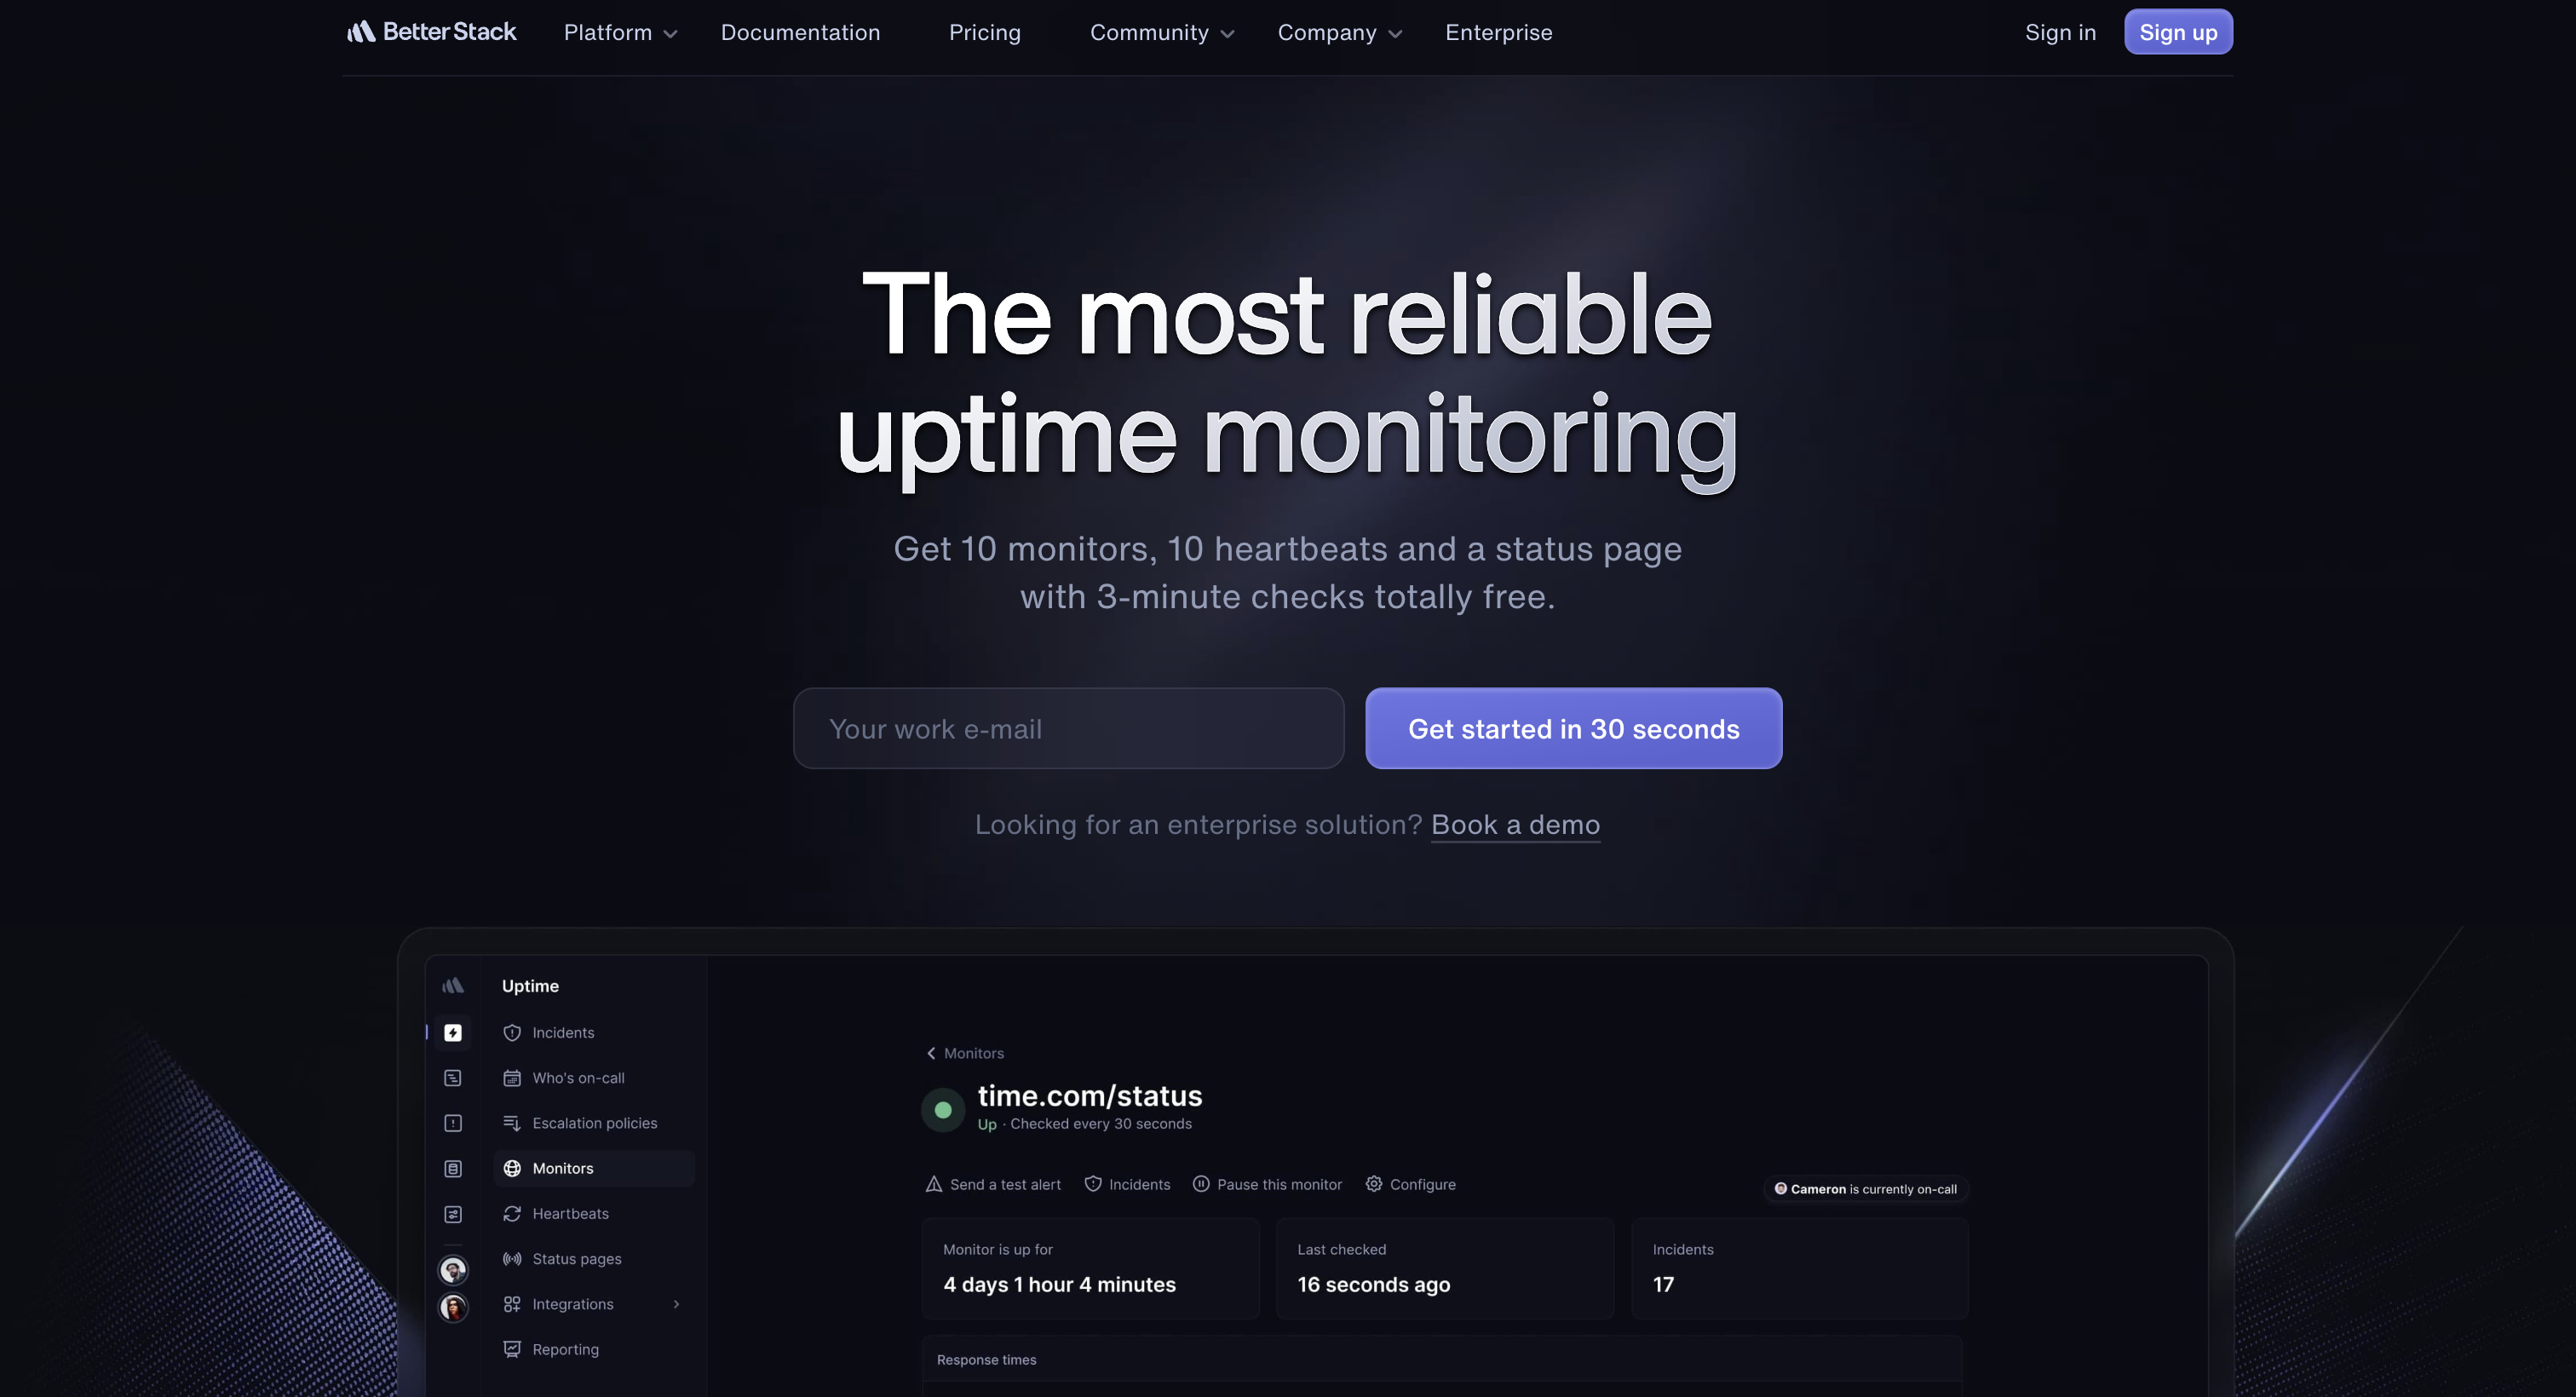
BetterStack combines uptime monitoring with a sleek incident management platform, making it easy to detect, respond to, and resolve API issues. It offers synthetic monitoring from 30+ locations, detailed incident timelines, screenshot evidence of downtime, and on-call scheduling. Beyond simple checks, it integrates with various tools for streamlined alerting and team collaboration during outages.
Key Features
- Synthetic API monitoring: Check API availability and response times from global locations.
- Built-in incident management: Incident timelines, escalation rules, and postmortems.
- On-call scheduling: Manage rotations and alerts for engineering teams.
- Visual failure evidence: Screenshots, logs, and error details for faster diagnosis.
- Team collaboration tools: Slack, PagerDuty, and Opsgenie integrations.
Pros:
- Integrated incident management and on-call scheduling.
- Visual proof of downtime with screenshots and error logs.
- Monitors from multiple global locations with flexible check intervals.
Cons:
- More expensive than basic uptime monitors due to advanced features.
- Focuses primarily on synthetic monitoring, less on deep APM.
- Reporting could be more customizable for specific API metrics.
Ideal For:
Teams needing robust uptime monitoring combined with effective incident management, clear communication, and on-call rotation features.
8. Datadog
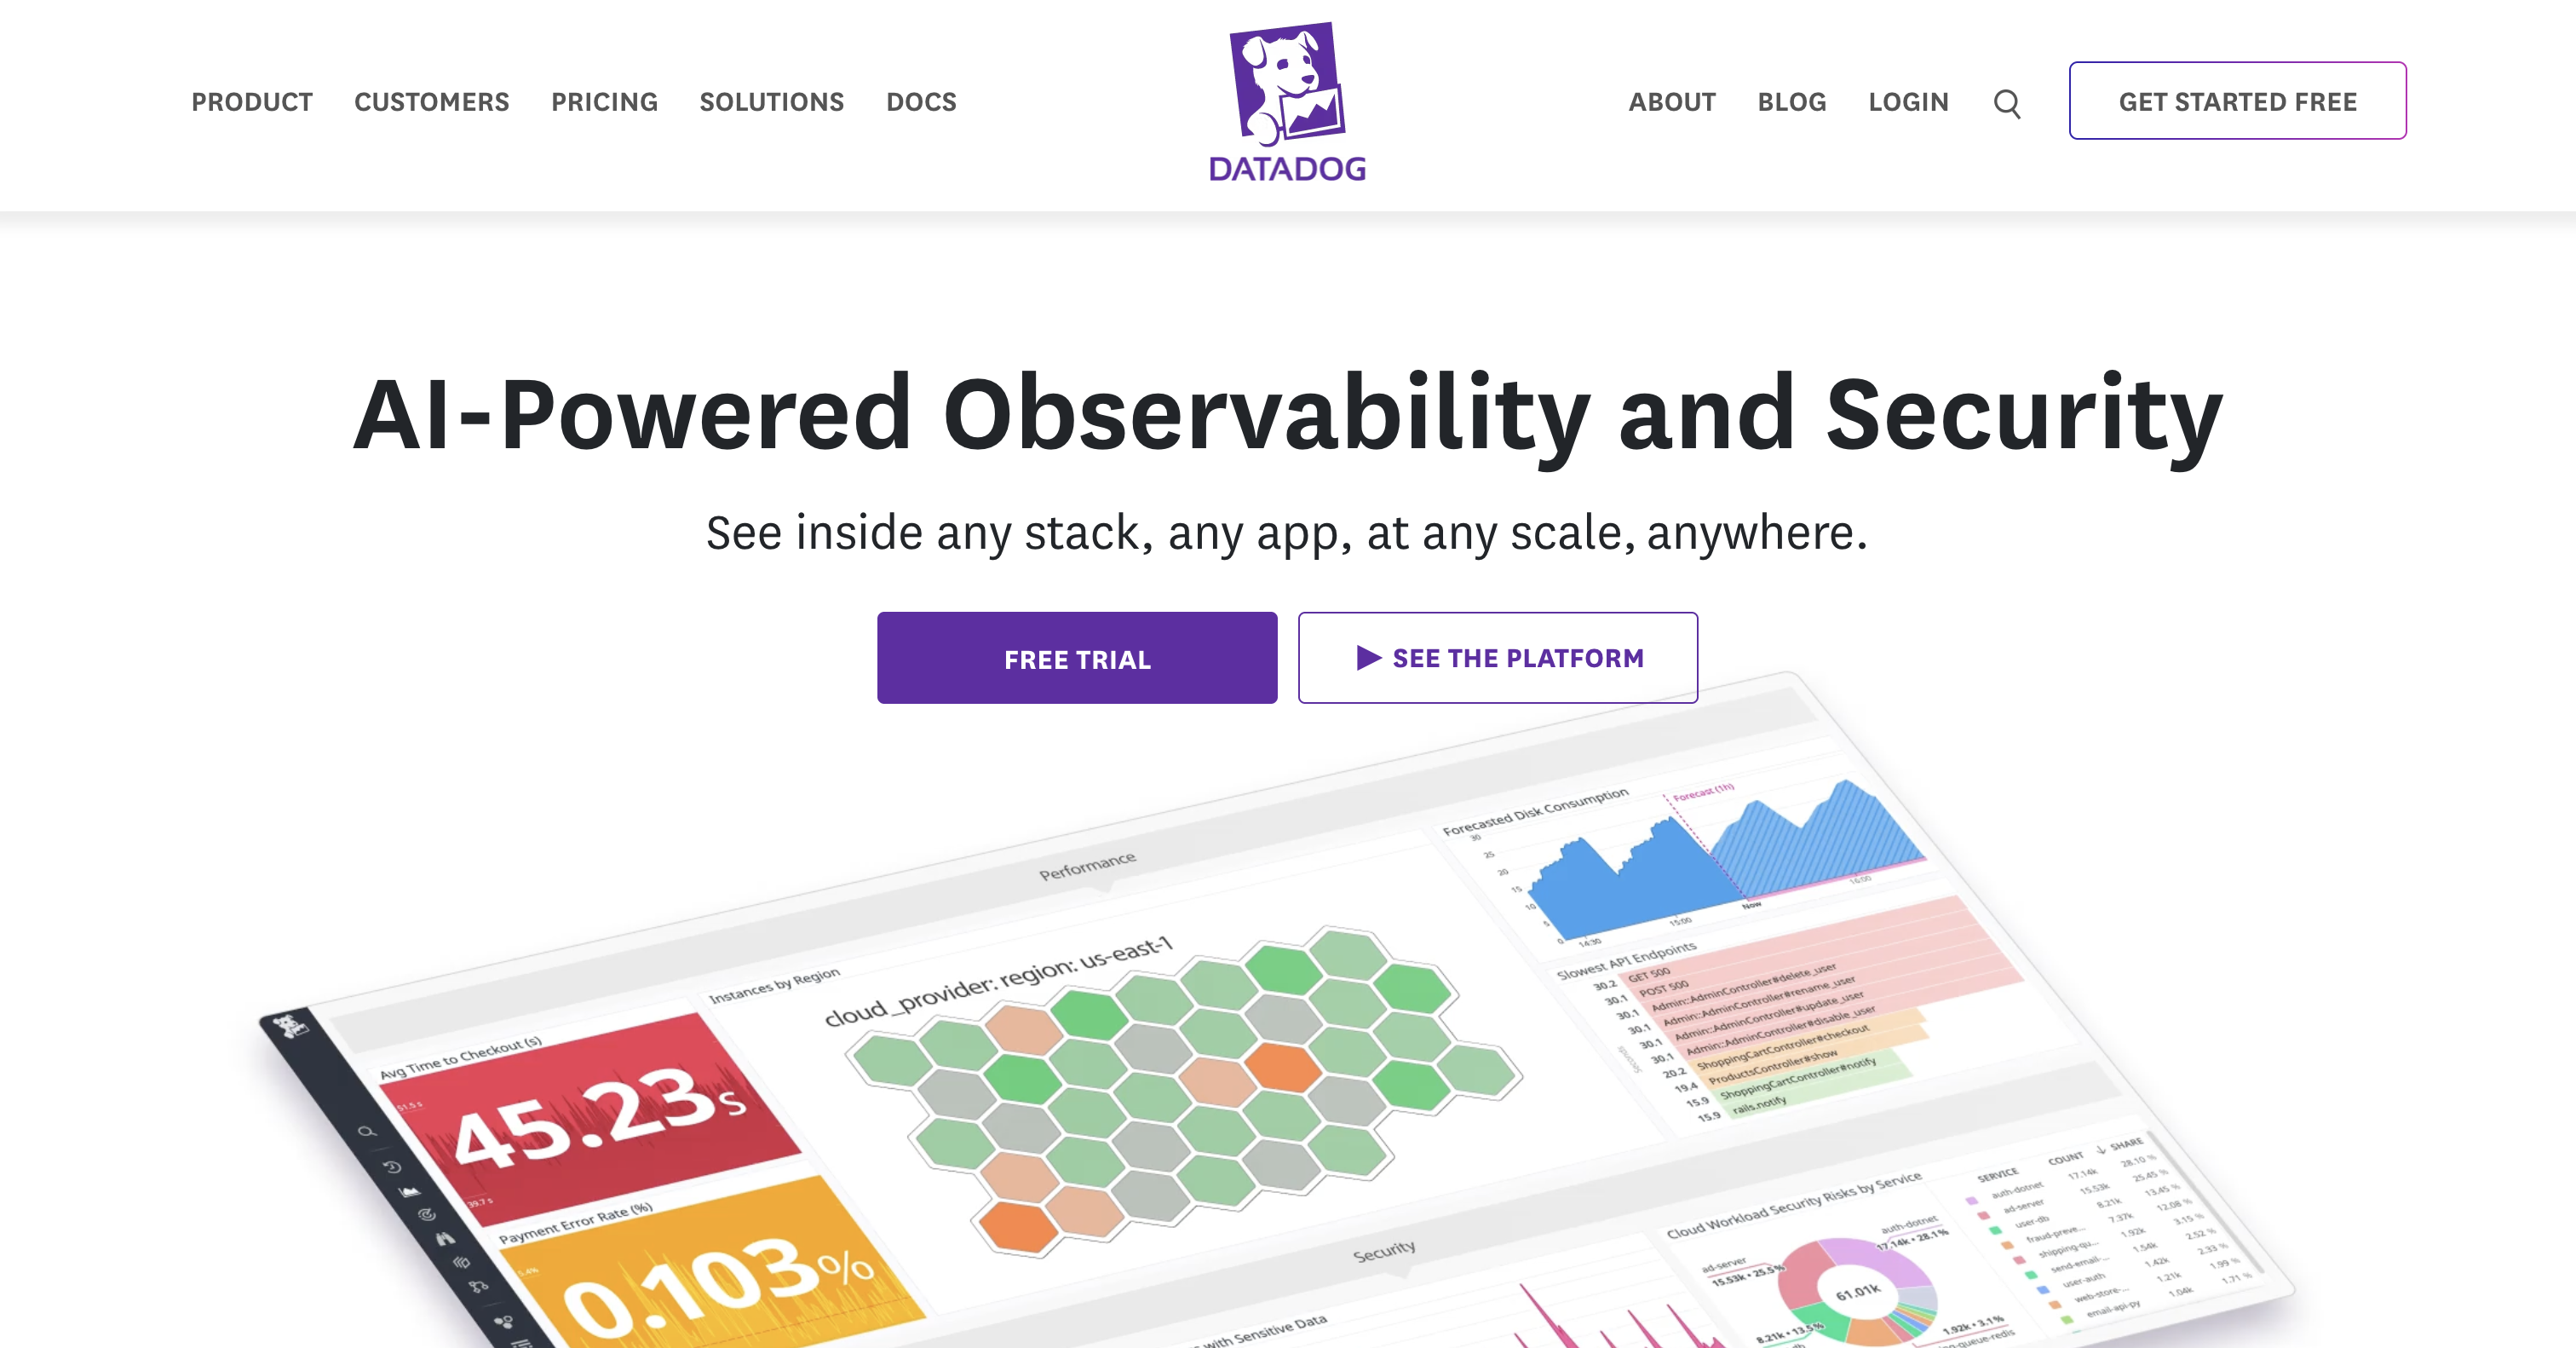
Datadog is a leading cloud monitoring and analytics platform that offers extensive API monitoring as part of its comprehensive observability suite. It provides synthetic API testing, real-time APM for microservices, and log management, allowing users to trace requests across distributed systems. Datadog's Synthetic Monitoring can simulate user journeys and API calls from various locations, giving a full picture of API health and performance.
Key Features
- Synthetic API testing: Simulate API calls and workflows from global regions.
- Application Performance Monitoring (APM): Trace API requests across microservices.
- Log & infrastructure correlation: Connect API failures with logs and infra metrics.
- Real-user monitoring (RUM): Measure actual user experience alongside synthetic tests.
- AI-powered anomaly detection: Automatically detects unusual behavior patterns.
Pros:
- Comprehensive full-stack observability, including APM, logs, and infrastructure.
- Synthetic monitoring combined with real-user monitoring and tracing.
- Rich dashboards, alerts, and AI-driven anomaly detection.
Cons:
- Can be costly, especially for large-scale deployments and extensive data retention.
- Steeper learning curve due to the breadth of features and configurations.
- Requires significant investment in setup and ongoing management.
Ideal For:
Large enterprises and complex microservices architectures needing end-to-end observability and advanced API performance insights across their entire stack.
9. New Relic
New Relic offers a powerful observability platform that includes robust API monitoring capabilities, ranging from synthetic API tests to deep APM for backend services. Its Synthetic Monitoring allows you to simulate user interactions and API calls from global locations, while New Relic APM provides code-level visibility into API performance. This combination helps identify bottlenecks, errors, and performance regressions across the entire application stack.
Key Features
- Synthetic API monitoring: Scripted API checks from global locations.
- Code-level APM insights: Trace API latency down to specific methods and queries.
- Distributed tracing: Track API calls across services and dependencies.
- Custom dashboards: Build API-focused performance and reliability views.
- Advanced alerting: Thresholds, baselines, and anomaly-based alerts.
Pros:
- End-to-end observability, covering synthetic, real-user, and APM.
- Code-level insights into API performance and errors.
- Customizable dashboards and advanced alerting features.
Cons:
- Pricing can be complex and expensive for high data volumes.
- Might be overwhelming for users new to observability platforms.
- Integration with non-standard tech stacks can be challenging.
Ideal For:
Organizations requiring deep code-level insights into API performance, combined with synthetic and real-user monitoring, for complex applications and microservices.
10. Dynatrace
Dynatrace is an AI-powered, all-in-one observability platform that automatically monitors and analyzes every aspect of your application ecosystem, including APIs. Its unique OneAgent technology provides continuous discovery and mapping of all dependencies, offering deep insights into API health, performance, and user experience. Dynatrace uses AI (Davis) to pinpoint root causes of issues, making problem resolution remarkably efficient for critical APIs.
Key Features
- Automatic API discovery: Detects APIs and dependencies without manual configuration.
- AI-powered root cause analysis (Davis AI): Pinpoints the exact source of failures.
- End-to-end request tracing: Full visibility from user request to backend execution.
- Dependency mapping: Visual maps of API interactions across services.
- Real-time monitoring: Continuous performance insights with minimal latency.
Pros:
- AI-powered root cause analysis for rapid problem identification.
- Automatic discovery and mapping of all API dependencies and interactions.
- Full-stack monitoring, from user experience to code level, in real-time.
Cons:
- Premium pricing, making it a significant investment.
- Complexity of the platform can be daunting for smaller teams.
- Requires dedicated resources for optimal setup and utilization.
Ideal For:
Large enterprises with complex, dynamic, and distributed environments that demand automated, AI-driven full-stack observability for their APIs and applications.
11. Prometheus + Grafana
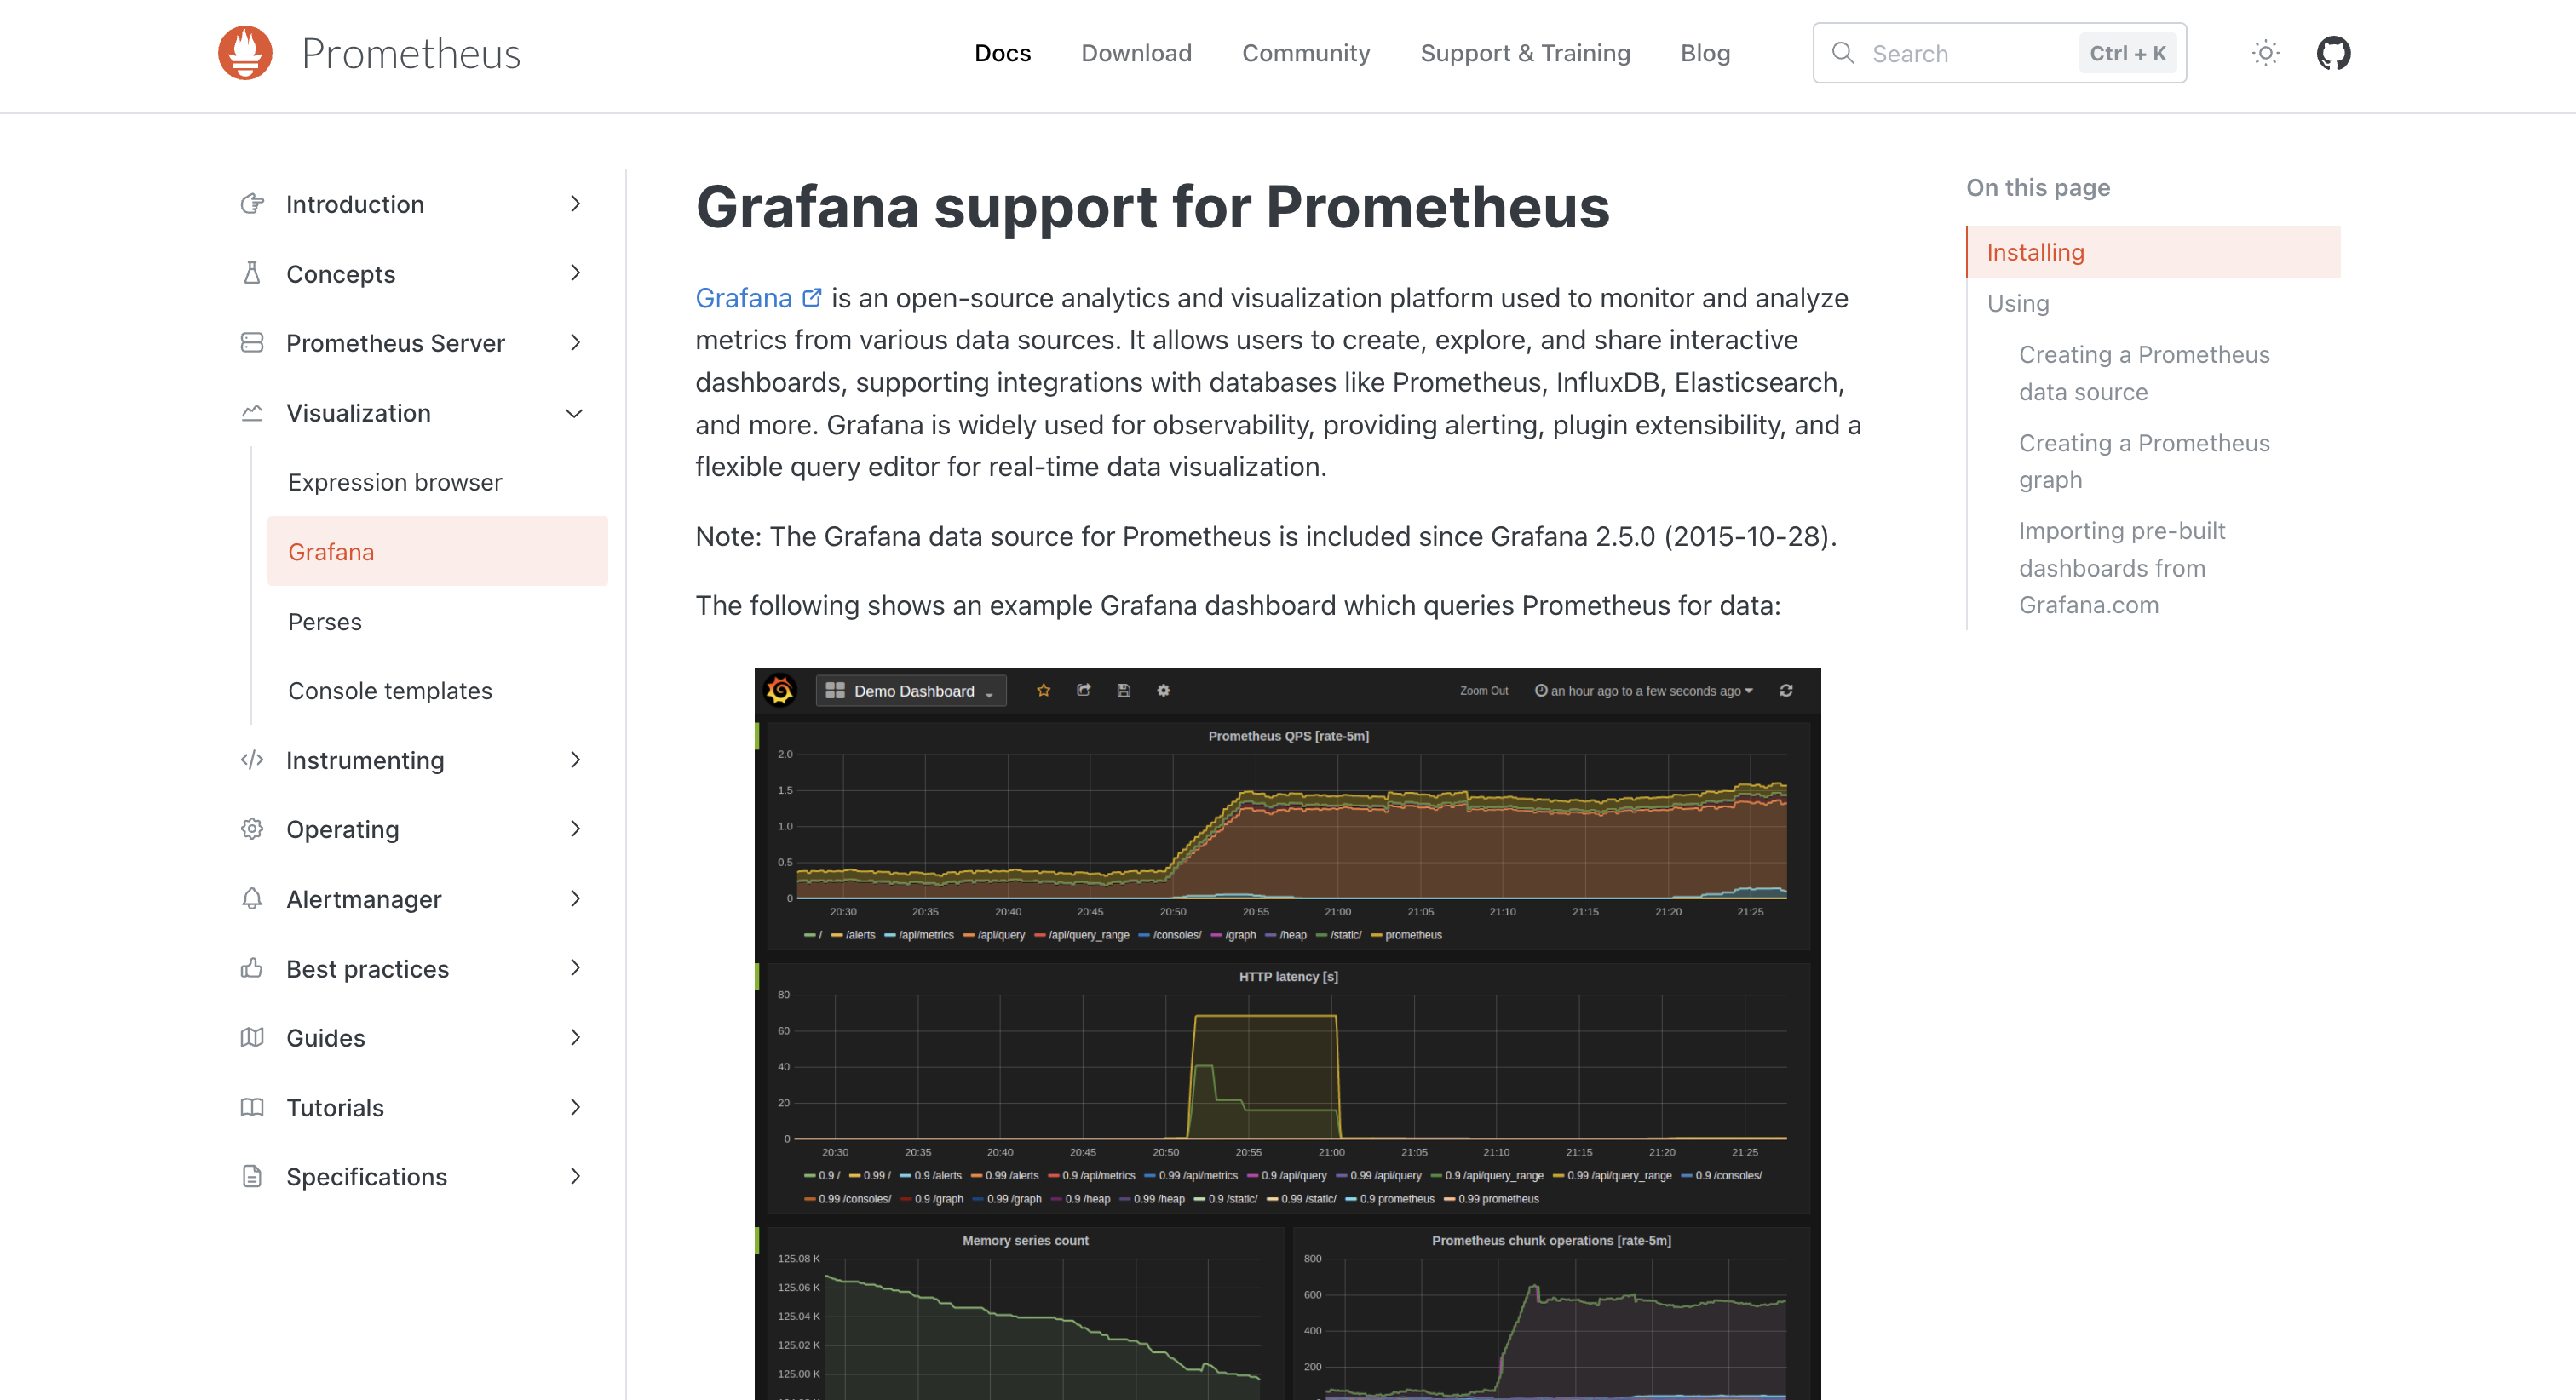
Prometheus is an open-source monitoring system that collects metrics from configured targets at given intervals, evaluates rule expressions, displays the results, and can trigger alerts. When paired with Grafana, an open-source analytics and visualization platform, it forms a powerful and highly customizable API monitoring solution. Teams can instrument their APIs to expose metrics, which Prometheus scrapes, and Grafana then visualizes with rich, interactive dashboards.
Key Features
- Custom API metrics collection: Instrument APIs to expose fine-grained metrics.
- Time-series data storage: Efficient storage and querying of performance metrics.
- Powerful alerting rules: Trigger alerts based on thresholds or expressions.
- Rich dashboards (Grafana): Highly customizable visualizations and charts.
- Open-source flexibility: Full control with no vendor lock-in.
Pros:
- Highly flexible and customizable for specific API metrics.
- Cost-effective, being open-source with a large community.
- Excellent for collecting granular, time-series data from APIs.
Cons:
- Requires significant setup, configuration, and maintenance effort.
- Lacks out-of-the-box synthetic monitoring from external locations.
- Doesn't provide built-in incident management or deep APM tracing.
Ideal For:
Tech-savvy teams with specific monitoring requirements who prefer open-source solutions and have the resources for custom instrumentation and setup.
Conclusion
API monitoring tools available today offer a spectrum of capabilities, from basic uptime checks to sophisticated AI-driven full-stack observability. Selecting the right solution hinges on understanding your specific needs, whether it's comprehensive APM for complex microservices, budget-friendly synthetic checks, or specialized AI insights for external API dependencies. Investing in effective API monitoring ensures your digital services remain available, performant, and reliable, safeguarding user experience and business continuity in an API-driven world.
FAQs
1. What is API monitoring and why is it important?
API monitoring is the practice of tracking an API's availability, performance, and functionality. It's crucial because APIs are vital connections for digital services. Effective monitoring identifies issues like downtime, slow responses, or incorrect data before they impact users or business operations, ensuring reliability and a seamless user experience.
2. What are the key features to look for in an API monitoring tool?
Look for features like synthetic monitoring from multiple global locations, real-time performance metrics (latency, error rates), functional validation (correct responses), alert mechanisms (email, SMS, webhooks), and robust reporting. For complex needs, consider tools with APM, distributed tracing, incident management, and AI-driven analytics.
3. What's the difference between synthetic and real-user API monitoring?
Synthetic monitoring actively simulates API requests from various locations to test performance and availability, providing controlled, consistent data. Real-user monitoring (RUM), on the other hand, collects data from actual user interactions with your applications, offering insights into real-world performance under diverse network conditions. Both are valuable but serve different purposes.
Dhayalan Subramanian is Associate Director, Product Growth at DigitalAPI, where he leads go-to-market and product growth for the company’s multi-gateway API management platform. His work focuses on helping large enterprises and mid-market cloud companies consolidate APIs across AWS, Azure, Apigee, Kong, MuleSoft, and other gateways into a single control plane for governance, discovery, monetization, and agent consumption.
Dhayalan brings 14+ years of experience across product strategy, enterprise architecture, and engineering leadership. Earlier in his career, he held senior roles at Encora (as Associate Architect and Technical Manager), Mindtree (Technology Lead), Tech Mahindra (Technical Lead), and Primus Analytics, where he designed integration frameworks and delivered enterprise-grade digital platforms for global customers.
At DigitalAPI, he works directly with platform, integration, and developer experience leaders at Fortune 500 organizations to operationalize unified API catalogs, developer portals, and MCP-ready APIs. He writes regularly on API developer experience, API governance, and AI agent architectures.

One email a fortnight. Worth opening.
A short digest of what we're writing, what we're learning from customers, and the handful of links you'd actually want from us. No tracking pixels.
.avif)